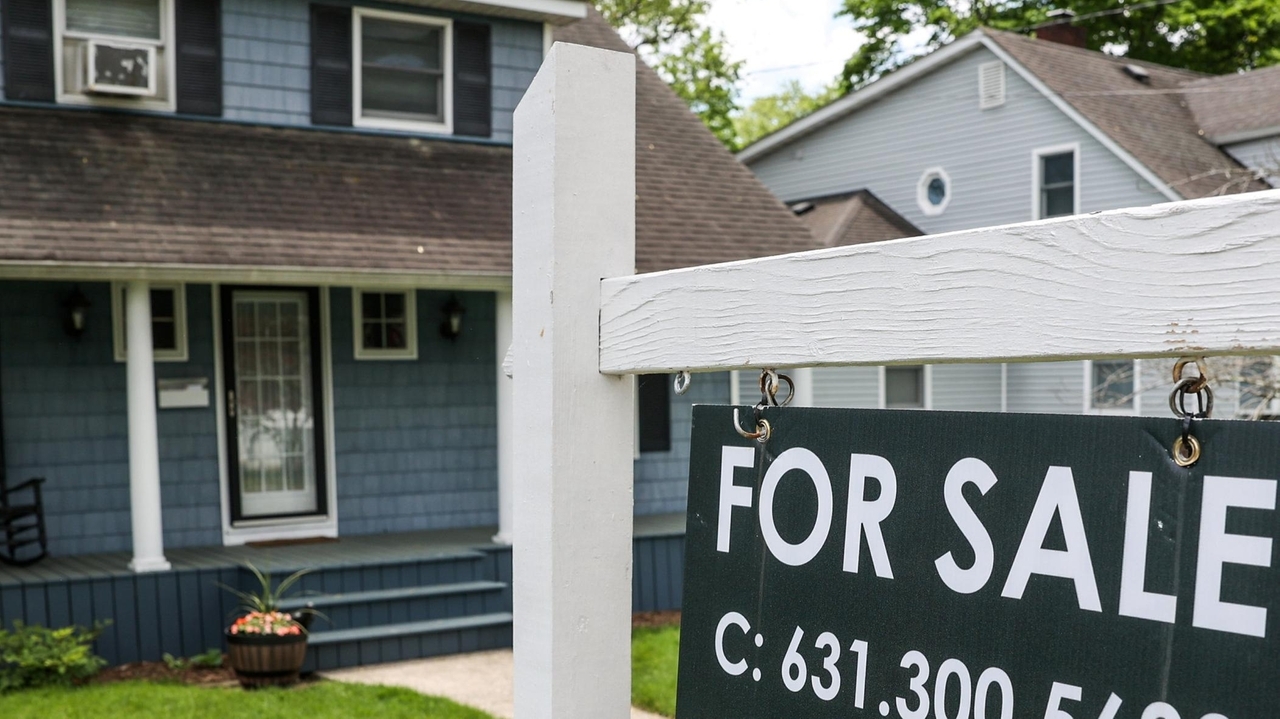
Long Island remains a strong seller's market heading into 2026 as inventory tightens and demand keeps prices elevated: November listings fell to 2,579 in Suffolk (-12.2% YoY) and 1,784 in Nassau (-15.6% YoY), median November sale prices were roughly $840,000 (Suffolk) and $725,000 (Nassau), and houses now average 37 days on market. Third-quarter data show about 60% of Nassau/Suffolk (ex‑East End) sales closed above asking and the Hamptons/North Fork inventories are sharply lower, so experts expect continued bidding wars and price pressure unless a large wave of supply emerges; a modest easing of mortgage rates (30‑year ~6.3%) could stabilize transactions but affordability remains a constraint, so sellers are advised to price and prepare strategically.
Market structure: Long Island’s data (inventory -12–16% YoY; days-on-market ~37; ~60% of sales > ask) signals persistent seller pricing power and high bid competition. Winners are listing brokers, local service providers, move-in–ready product and home-improvement retailers; marginal buyers and affordability-sensitive lenders are the losers. Sustained tight supply implies pricing elasticity is low until inventory meaningfully expands (>20% YoY) or mortgage rates rise >150–200bps.
Risk assessment: Key tail risks are a shock rise in 30-year mortgage rates above ~7.5% (materially reducing qualified buyer pool), a foreclosure/inventory surge from recession causing a 10–20% local price repricing, or regulatory changes loosening mortgage underwriting that temporarily expands demand. Near-term (days–months) sensitivity is to mortgage-rate moves and local permit data; medium-term (quarters) to construction starts and zoning changes.
Trade implications: Favor exposure to renovation/maintenance beneficiaries (HD, LOW) and title/transaction service providers over homebuilders; expect builders’ margins to be capped by land/cost constraints. Use relative-value: long broker/transaction platforms (COMP) vs short large homebuilders (DHI or XHB) to capture widened spread between transaction servicing and new supply creation. Hedge rate-tail via short-duration puts on equities or buy protection in MBS/interest-rate space.
Contrarian angles: Consensus underestimates sellers-turned-buyers stress (many will need bridge financing), which amplifies demand for short-term credit and iBuyer/bridge lenders. The market may be underpricing renovation-driven revenue growth vs new-construction exposure; historical parallels (post-2008) show rapid inventory expansion can reverse prices — monitor building permits as a 3–6 month leading indicator.
AI-powered research, real-time alerts, and portfolio analytics for institutional investors.
Request DemoOverall Sentiment
mildly positive
Sentiment Score
0.30
Ticker Sentiment
