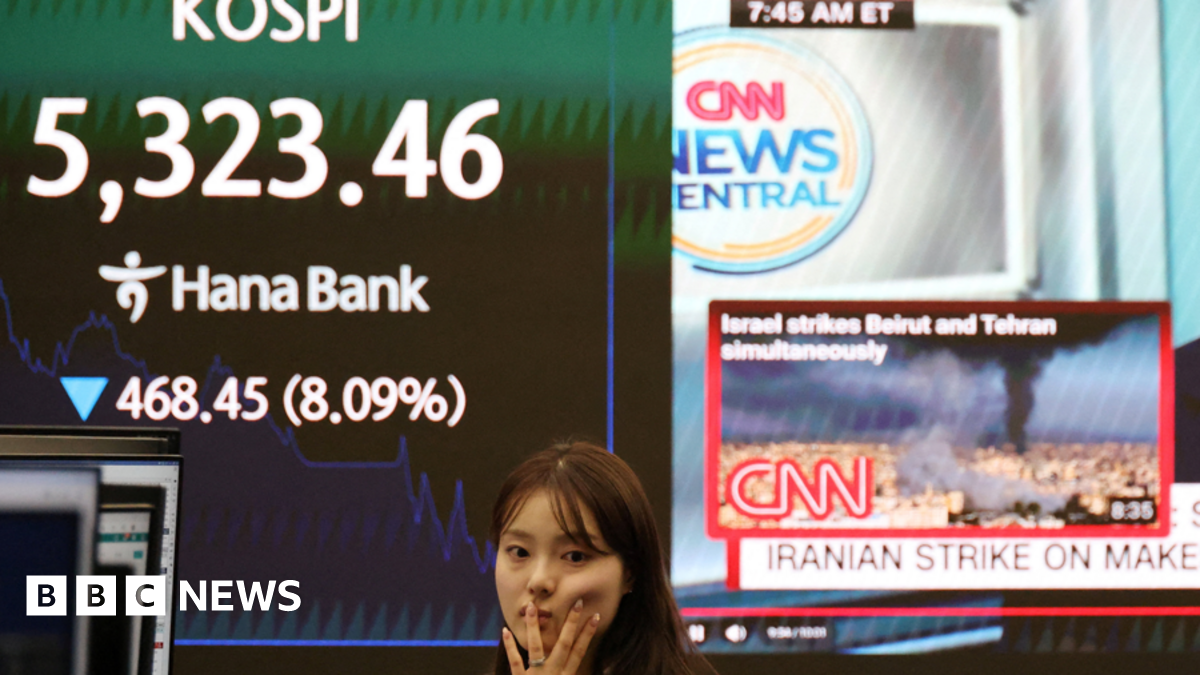
Global risk assets moved into a risk-off posture as the US-Israel attacks on Iran and subsequent regional strikes pushed Brent crude up 2.5% to $83.96 (about +15% since the weekend) and gas volatility spiked (around 143p per therm vs Tuesday's 170p high). Asian markets were hit hard — South Korea's Kospi tumbled 12% triggering a circuit breaker, Japan's Nikkei fell 3.6% and Hong Kong's Hang Seng lost 2.5% — while gold ticked higher to $5,169, underscoring safe-haven demand and shipping disruption risks through the Strait of Hormuz. UK markets showed relative calm but policymakers are reacting: Chancellor Reeves is meeting North Sea energy bosses after the OBR revealed pre-conflict fiscal headroom of £23.6bn (up from £21.7bn) and warned the war could have a very significant economic impact, potentially altering inflation and Bank of England rate-cut expectations ahead of the 19 March decision.
Market structure: Energy producers (integrated majors XOM, CVX, and ETF XLE) and physical/financial gold (GLD/IAU) are immediate beneficiaries as Brent jumped ~15% to $84 and Strait of Hormuz traffic is disrupted (~20% of global flows). Losers include export-dependent Asian markets (KOSPI, EWY; Nikkei/EWJ) and airlines/shipping names that face higher fuel and insurance costs; UK fiscal headroom is vulnerable as gilt yields rise. Supply/demand: a near-term tightening is evident — tactical shipping shutdowns and insurance cost increases reduce effective supply; downside is capped by spare OPEC+ capacity and US shale responsiveness over 3–6 months.
Risk assessment: Tail risks include full closure of the Strait of Hormuz or direct naval engagement (low-probability, high-impact) that could push Brent >$120 and gas spikes comparable to 2022, forcing central banks to pause cuts. Time horizons: immediate (days) = volatility and circuit breakers; short-term (weeks–3 months) = realized commodity spikes, insurance premium repricing; medium (3–12 months) = inflation stickiness, central bank policy drift. Hidden dependencies: China/Russia energy flows, shipping insurance availability, and NATO/US naval decisions are critical catalysts.
Trade implications: Tactical overweight energy and gold while hedging geopolitical tail risk — prefer 1–3 month exposures with defined loss profiles. Rotate out of Asia export cyclicals and discretionary travel names into energy, defense suppliers, and USD funding instruments; favor assets that benefit from higher real yields if inflation surprises (short-dated nominal gilts/sovereign duration shorts). Use volatility products to hedge rapid sentiment swings rather than outright directional bets.
Contrarian angles: The market may be overpricing long-term supply destruction — spare OPEC+ capacity plus US shale can cap upside within 3–6 months, making very long-dated outright oil longs risky. Asian equity panic (e.g., Kospi -12% day) likely contains mean-reversion trades once maritime routes are defended; look for idiosyncratic dislocations in Korean tech exporters. Unintended consequence: aggressive energy longs could flop if shipping insurance/re-flagging succeeds quickly, so prefer spreaded/options-defined-risk exposure.
AI-powered research, real-time alerts, and portfolio analytics for institutional investors.
Request DemoOverall Sentiment
strongly negative
Sentiment Score
-0.65