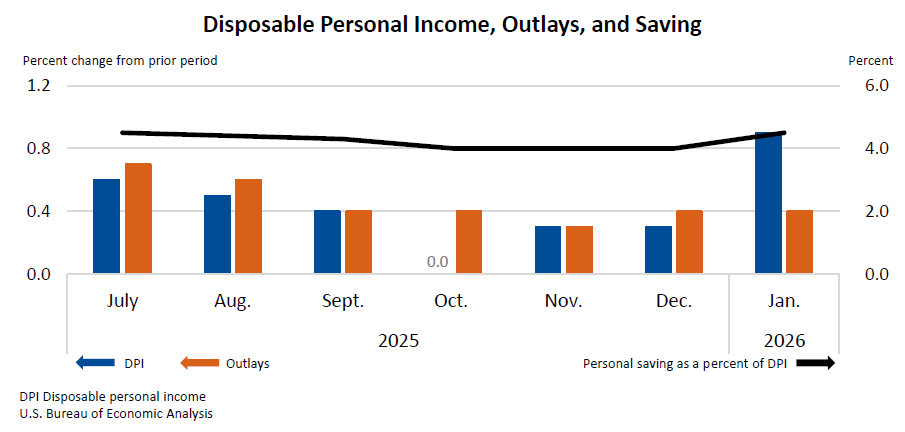
Personal income rose $113.8B (0.4% m/m) in January; disposable personal income increased $219.9B (0.9%) and PCE rose $81.1B (0.4%), while real PCE increased $17.0B (0.1% m/m). The PCE price index was up 0.3% m/m and 2.8% y/y; core PCE (ex-food and energy) rose 0.4% m/m and 3.1% y/y. Personal saving was $1.05T with a saving rate of 4.5%. Income gains were driven by compensation (+$83.7B, wages & salaries +$71.2B), personal dividends (+$44.6B) and transfer receipts (+$18.0B, including a $49.2B Social Security COLA); the release was rescheduled due to the Oct–Nov 2025 government shutdown.
January’s data reveal a consumption composition shift that markets are underweight: services demand is re-accelerating while goods demand is softening, and a disproportionate share of recent income gains flowed to dividend recipients and transfer-payment beneficiaries. That combination is uneven for corporate revenue — service‑heavy businesses (travel, leisure, healthcare) get a cleaner lift in volume and pricing power, whereas goods‑centric supply chains face demand erosion and margin compression as inventories adjust. From a policy lens, the persistence of core services inflation increases the probability that the Fed tolerates a higher short‑term real rate for longer; but weak real consumption growth tempers the odds of aggressive hikes, leaving pricing friction concentrated in the belly of the yield curve. Key near‑term catalysts that will re‑price these dynamics are labor prints, upcoming CPI/PCE releases, and earnings from large consumer and travel companies — expect market moves to play out over weeks to a few quarters rather than intraday shocks.
AI-powered research, real-time alerts, and portfolio analytics for institutional investors.
Request DemoOverall Sentiment
neutral
Sentiment Score
0.00