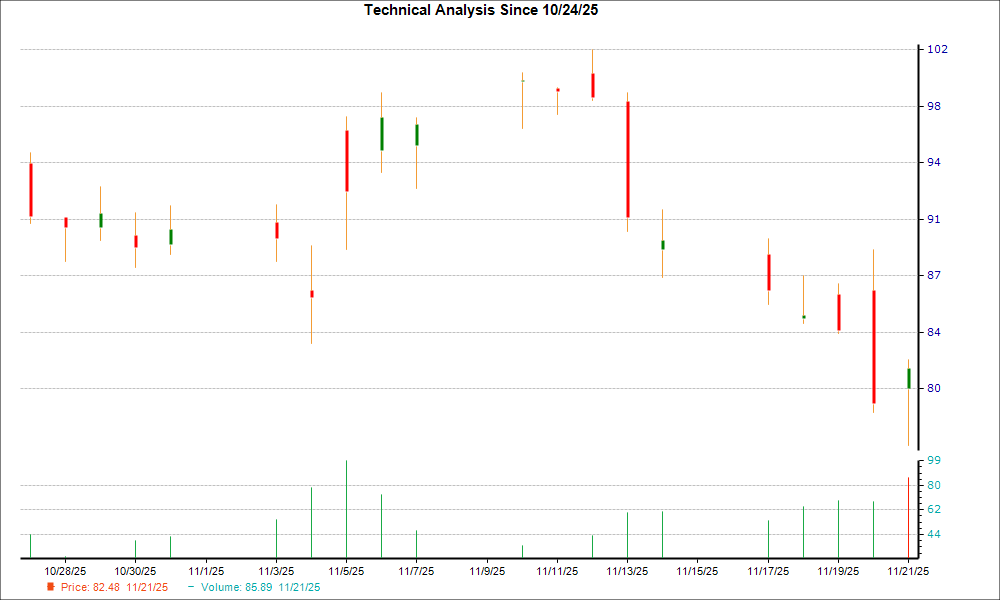
Everus Construction Group (ECG) has declined 8.5% over the past week but printed a hammer candlestick in its most recent session, suggesting a possible technical bottom and short-term trend reversal. Fundamental support accompanies the pattern: consensus EPS for the current year has been revised up 21.9% over the last 30 days and the stock carries a Zacks Rank #1 (Strong Buy), a combination that may prompt buyers, though the signal remains speculative pending follow-through price/volume and actual earnings outcomes.
Market structure: a tactical stabilization in a single mid-cap construction name would primarily benefit upstream suppliers (steel, cement, equipment lessors) and specialist subcontractors as orders reaccelerate, while highly levered regional peers and small-cap developers would suffer margin pressure if input costs or financing tighten. Pricing power shifts are likely incremental — meaningful share gains require sustained backlog conversion over 2-4 quarters; expect commodity demand to lift industrial metals by low-single-digit percent if trend broadens. Cross-asset: lower idiosyncratic equity volatility would compress options IV; improving credit perception could tighten BB/BBB spreads by 20–50 bps for sector credits; watch base-metal futures and short-term swap curves for early signal changes.
Risk assessment: tail risks include a single large contract termination, a 100–200 bps jump in local funding rates, or a surprise warranty/liability charge that could wipe out one-to-two quarters of EBITDA; probability low but impact high. Near-term confirmation requires price/volume follow-through within 5–10 trading days and an earnings beat in the next report; if either fails, expect a 15–30% downside reversion. Hidden dependencies: concentrated client exposure, on-balance-sheet project financing maturities within 12 months, and pass-through clauses for commodity inflation — each can flip a constructive view rapidly.
Trade implications: implement a staged directional trade: initial 2–3% portfolio long position in ECG with a hard stop at 10% and a target of +25% over 3–6 months, ratcheting to 4–5% on confirmed volume/earnings. Option strategy: buy a 3-month call spread (buy ATM, sell 20% OTM) sized to risk 0.5–1% of NAV to cap downside while allowing 2–3x upside. Sector tilt: overweight materials (XLB) and industrials (XLI) by 3–5% versus underweight REITs/large-cap homebuilders by 2–3% until backlog visibility clears.
Contrarian angles: consensus may be overstating sustainable margin recovery — a one-off contract or favorable timing can drive estimate revisions that reverse quickly; if next EPS misses by >10% vs. revised consensus, anticipate a 20–30% drawdown. The bullish technical read is vulnerable to low follow-through; historical small-cap construction rebounds often fade without 6–12 month revenue conversion. Unintended consequence: share strength could precipitate dilutive equity issuance — monitor share count and insider selling within 30 days.
AI-powered research, real-time alerts, and portfolio analytics for institutional investors.
Request DemoOverall Sentiment
mildly positive
Sentiment Score
0.28
Ticker Sentiment
