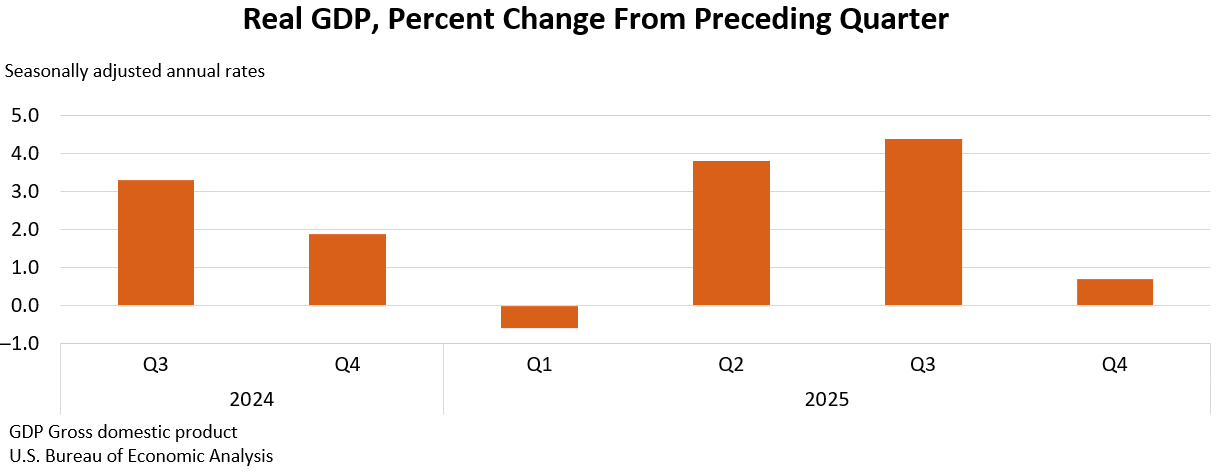
Real GDP rose 0.7% annualized in 2025 Q4 (down from 4.4% in Q3) and was revised down 0.7 percentage point from the advance estimate. Growth was driven by consumer spending and investment and partly offset by declines in government spending and exports; BEA estimates the October–November 2025 federal shutdown subtracted about 1.0 percentage point from Q4 GDP. Full-year 2025 real GDP increased 2.1% (revised down 0.1ppt); Q4 PCE inflation was 2.9% (core 2.7%) and the gross domestic purchases price index rose 3.8%.
BEA’s handling of missing October price data and the embedded effects of the federal lapse create a two-fold measurement risk: headline quarter-to-quarter metrics are mechanically smoothed and a portion of economic activity is a timing artifact. Market participants that trade off headline prints will misprice the persistence of weakness if the next releases show catch‑up spending from back‑paid employees and delayed projects coming back on-line.
Sectoral microdynamics point to uneven pockets of pressure and resilience. Vendors of labor‑intensive state and local construction activity and healthcare service providers face compressed near‑term demand and order deferrals, while firms exposed to goods retailing, logistics, and intermediates for manufacturing are insulated by more resilient physical demand and inventory flows. IP and software investment volatility raises downside tail risk for mid‑cap tech vendors reliant on cyclical corporate capex rather than recurring SaaS revenue.
Timing matters: expect knee‑jerk moves in rates and cyclicals in the first 48 hours, more informative signal from agency capex and state VPIP data over 1–3 months, and corporate guidance/earnings revisions over 3–6 months that will decide whether this is a transient measurement issue or a sustained slowdown. The contrarian case that consensus is over‑discounting a durable slowdown rests on two realistic catalysts—administrative catch‑up spending and inventory restocking—which could produce meaningful upside to cyclical earnings in the next two quarters if realized.
AI-powered research, real-time alerts, and portfolio analytics for institutional investors.
Request DemoOverall Sentiment
mildly negative
Sentiment Score
-0.25