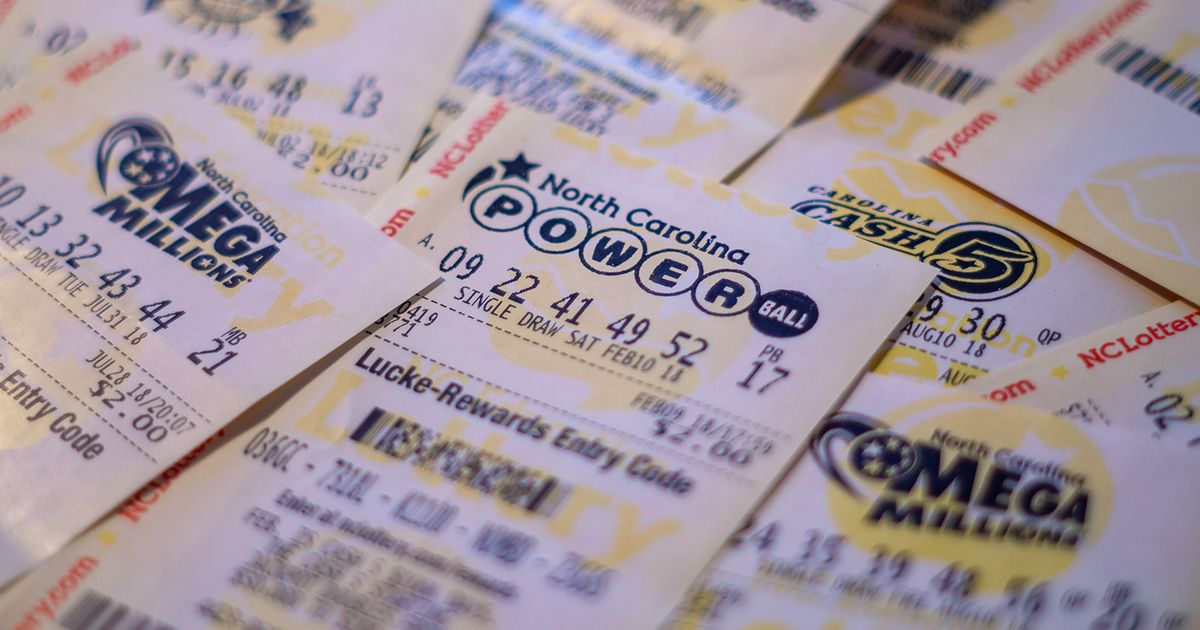
A private audit found that North Carolina Education Lottery transfers to public education fell to 16% of sales in fiscal 2025 despite record sales growth, with sales rising from $5.376bn in 2024 to $6.586bn in 2025 while transfers declined from $1.07bn to $1.05bn. The audit attributes the shrinking education share — down from 23% in 2023 and 20% in 2024 to 16% in 2025 — primarily to higher player payouts (player share rose from 66% to 76%), fewer mega-jackpots (six $1bn+ jackpots in 2024 vs two in 2025) and the introduction of higher-payout digital instant games; the report also notes the legislature removed the prior 35% education requirement. The findings imply volatility in state education funding tied to lottery product mix and jackpot dynamics, raising governance and budgetary risk for policymakers and stakeholders.
Market structure: Rising lottery sales (+22.5% YoY to $6.586bn) with falling education transfers (23%→20%→16% in three years) implies product-mix change — more high-payout digital instant games and fewer profitable mega-jackpots — shifting gross margin away from the sponsor (state) toward players. Suppliers of digital platforms, terminals and payment rails capture higher transaction volumes even if state profits compress; brick‑and‑mortar scratch manufacturers are secondary beneficiaries. Expect slower incremental leverage to state fiscal receipts and greater earnings asymmetry for vendors whose contracts are per-ticket/transaction rather than profit‑share. Risk assessment: Tail risks include a legislative reversal (restore 35% floor) within a 3–12 month window that forces larger transfers from game proceeds or operational changes, and reputational/regulatory curbs on digital instant products. Short-term (days–weeks) headline risk from the audit may drive local political action; medium term (3–12 months) is when statutory change or vendor contract renegotiations could hit revenues; long term (12+ months) a sustained product mix toward high-payout digital games could reduce state dependence on lottery proceeds. Hidden dependency: vendor revenue may be sticky while state budget suffers, creating political pressure for subsidy or regulatory repricing. Trade implications: Tilt toward suppliers of lottery technology/platforms (IGT, LNW) while hedging policy risk; avoid long exposure to entities relying on lottery transfers to fund recurring public projects or muni credits concentrated in NC. Use concentrated equity positions sized 1–3% of portfolio with hard stops and 6–12 month horizons, and buy event-driven protection (puts or verticals) sized to potential legislative shock. Catalysts to watch: NC legislative calendar, governor statements, next auditor hearing, and quarterly product-mix disclosures from vendors. Contrarian angles: Market consensus may overweight the headline “record sales = winner” narrative; that misses margin erosion from higher payout ratios (66%→76% payback). Mispricing opportunity: vendors with fee-for-service models (per-transaction/platform fees) are underappreciated relative to state/fund flow risk — they can grow revenue even if state distributions shrink. Conversely, if lawmakers re-impose a 35% floor, lottery operators (state) and vendors tied to high-payout digital products could see immediate policy-driven churn.
AI-powered research, real-time alerts, and portfolio analytics for institutional investors.
Request DemoOverall Sentiment
moderately negative
Sentiment Score
-0.35
