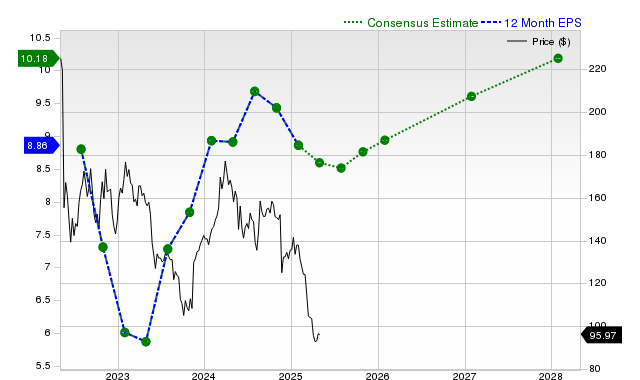
Target is seeing downward revisions to near-term earnings and sales expectations: consensus EPS for the current quarter is $2.16 (‑10.4% YoY, consensus down 4.2% in 30 days) and fiscal‑year EPS is $7.30 (‑17.6%), while next fiscal EPS is $7.75 (+6.2%). Revenue consensus is $30.6B for the current quarter (‑1% YoY) with full‑year estimates of $104.88B (‑1.6%) and $107.16B (+2.2% next year). In the last reported quarter Target posted $25.27B revenue (‑1.6% YoY) and $1.78 EPS (vs $1.85 a year ago), a slight revenue miss (‑0.35%) and modest EPS beat (+1.14%); Zacks assigns a Rank #3 (Hold) and a Value Style Score of A.
Market Structure: Softer demand at Target redistributes share toward price-anchored competitors (WMT, COST, DLTR) and Amazon for convenience; expect promotional intensity to rise 200–400 bps seasonally, compressing gross margins across mid‑tier retail in the next 2–6 months. Suppliers of discretionary categories (apparel, home) will see order smoothing, with inventory destocking signaling a short-term supply glut that should normalize by Q2 next year if sales rebound. Cross-asset: expect a modest widening of TGT credit spreads (20–50bp tail risk) and a 15–30% lift in near-term equity implied volatility; dollar moves and commodity impacts will be second-order unless multiple retailers report simultaneous weakness.
Risk Assessment: Tail risks include a consumer-credit shock or an 8–12% inventory write-down that would force margin restoration via deeper markdowns; regulatory or operational shocks (cyber, large-scale shrink) are low probability but high impact. Immediate window (days) is dominated by IV and post‑earnings drift; weeks–months hinge on holiday cadence and October/November sales; long term (3–12 months) is market-share and private‑label mix. Hidden dependencies: merchandise cadence, shrinkage trends, and lease expirations can flip profitability quickly; catalysts include WMT/AMZN quarterly commentary, CPI/employment data, and Fed policy shifts.
Trade Implications: Direct: establish a small, defined‑risk bearish exposure to TGT — buy 3–6 month 25–delta puts or a 3×1 put spread sized 1.5–2% of portfolio, close on a 20% share decline or if guidance improves >5%. Pair: short TGT vs long COST or WMT (1.25:1 notional) for 3–6 months to capture share reallocation and margin resilience in big‑box and membership models. Options: sell near‑dated calls (30–45 days) to harvest elevated IV if entering a neutral view, or buy 3–6 month calls on WMT/COST as convex longs; hem positions after next quarter’s earnings release.
Contrarian Angles: Consensus underweights potential margin recovery from targeted clearance and private‑label SKU rationalization — a 200–300bp gross margin rebound is plausible over 4–8 quarters if inventory normalizes. The market may be pricing structural loss of share too aggressively; if TGT stabilizes sales two months into the holiday season, IV compression could make short‑term put premiums overvalued by 30–50%. Unintended consequences include activist interest or accelerated share buybacks if management deems the valuation attractive, which would rapidly reprice the name.
AI-powered research, real-time alerts, and portfolio analytics for institutional investors.
Request DemoOverall Sentiment
mildly negative
Sentiment Score
-0.25
Ticker Sentiment
