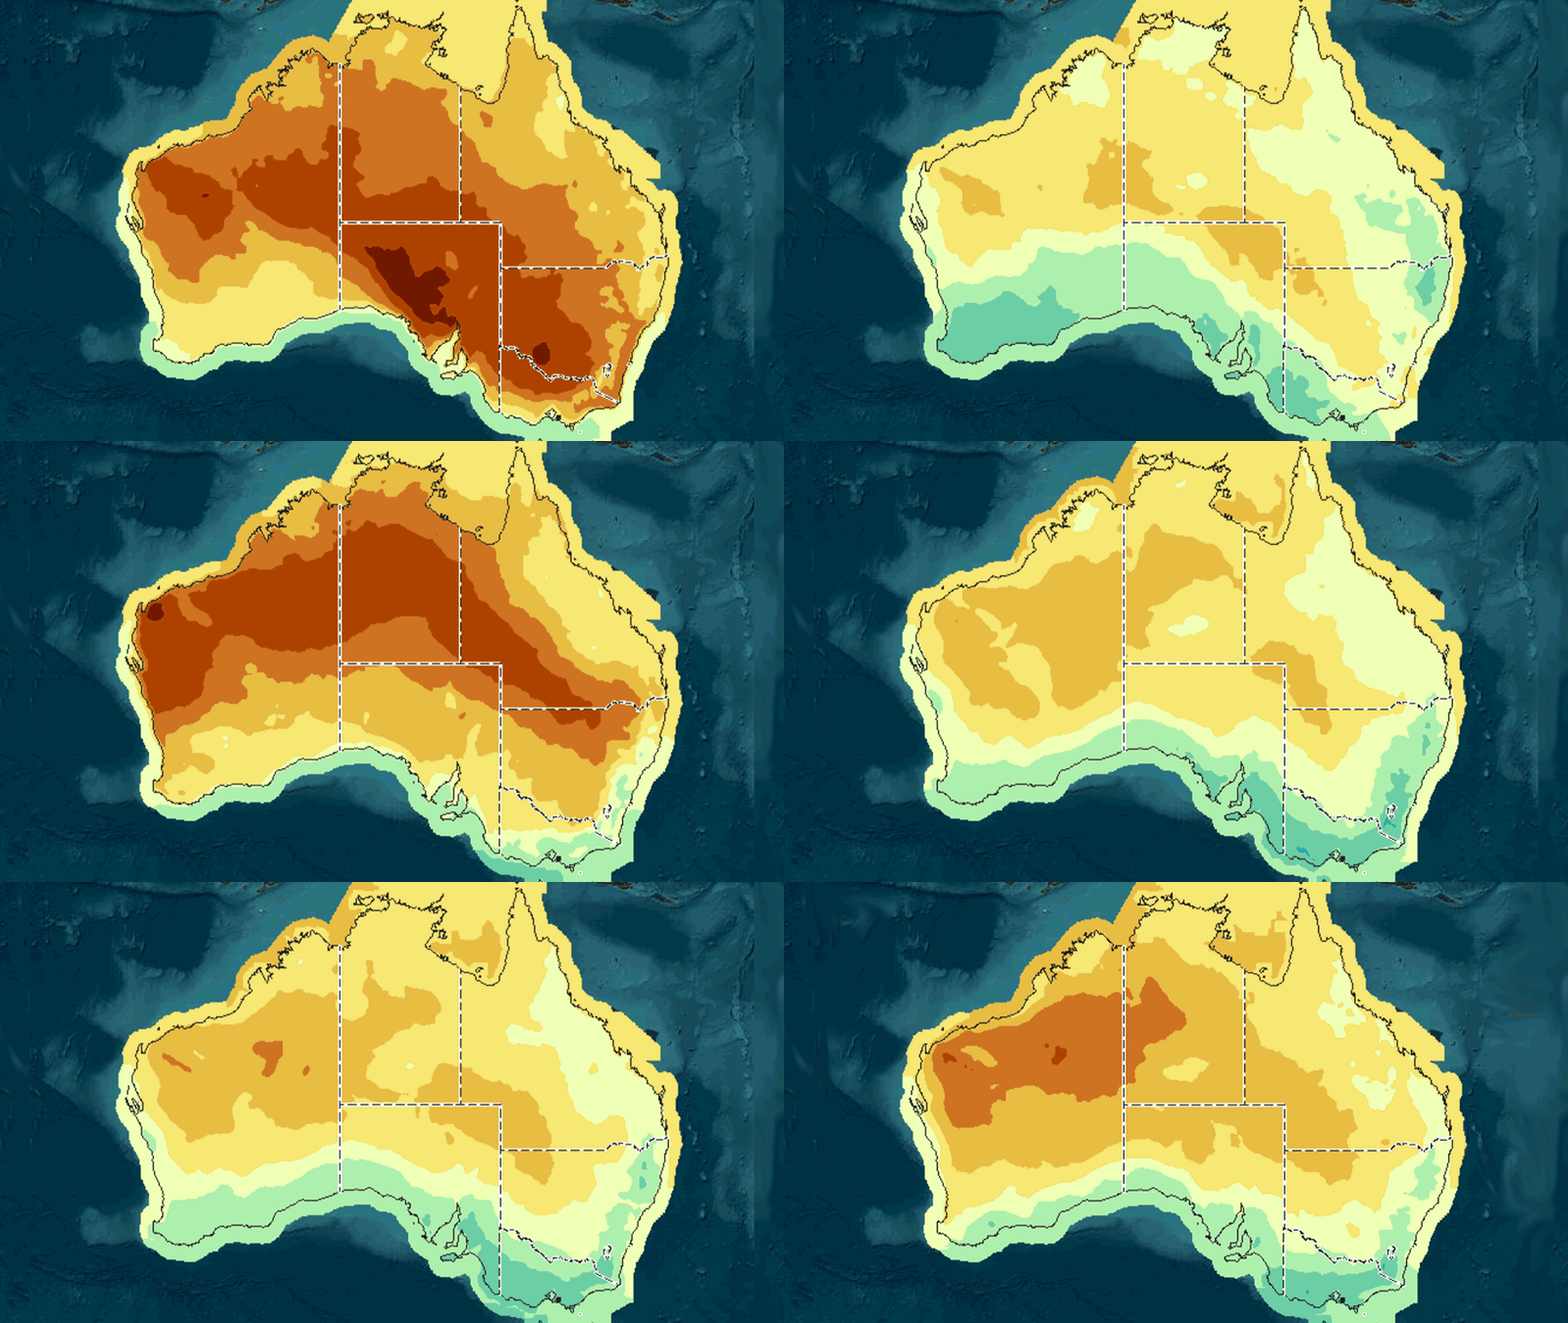
A severe heatwave originating in Western Australia has driven extreme temperatures across much of the country — Onslow reached 49°C, Port Augusta 46.3°C, Geelong 43.3°C and parts of Victoria hit 44.7°C — with Sydney forecast to peak around 42–43°C this weekend. Authorities have declared statewide total fire bans in Victoria and warned of extreme to catastrophic fire conditions, raising near-term operational risks for energy demand, insurance losses and regional supply-chain disruption; scientists and monitoring agencies link the event to the increasing intensity and likelihood of heatwaves driven by climate change.
Market structure: Extreme heat and elevated bushfire risk create short, sharp winners in electricity generators/retailers (spot price spikes +20–50% on peak days), battery/storage owners and building materials (demand for repairs). Clear losers: regional retail, airlines (operational cancellations), insurers/reinsurers facing elevated claims; mining can see production curtailments in Pilbara, pressuring export volumes and the AUD. Cross-asset: expect near-term volatility in gas and power forwards, upward pressure on carbon/energy hedges, and potential widening of insurance credit spreads.
Risk assessment: Tail risk includes multi-state catastrophic fires causing insured losses in the AUD1–5bn range and a reinsurance repricing shock that could force balance-sheet actions (capital raises) within 3–6 months. Immediate (days) risks are operational (power outages, flight cancellations); short-term (weeks–months) risks are earnings hits and higher claims; long-term (years) is policy-driven accelerated capex for grid resilience and higher insurance premia. Hidden dependencies: supply-chain chokepoints (ports, road closures) can transmit to iron ore shipments and LNG schedules, moving AUD and commodity curves.
Trade implications: Tactical plays favor near-term long exposure to energy suppliers/ storage (capture spot spikes) and defensive building-materials, combined with hedges against insurer downside via put spreads. Use 1–3 month options to monetize event volatility; rotate 3–6% of equity allocation into utilities/renewable infrastructure for 6–12 months while underweight regional consumer and airline names over the same window. Time action within the next 7–14 days for event-driven trades; hold structural trades 3–12 months.
AI-powered research, real-time alerts, and portfolio analytics for institutional investors.
Request DemoOverall Sentiment
moderately negative
Sentiment Score
-0.45
Contrarian angles: Markets underprice policy acceleration — large public capex for grid/fire mitigation within 6–18 months would re-rate renewables/infrastructure names beyond one heat season. Conversely, insurers may be oversold if regulators enable faster premium resets; historical precedent (2019–20 fires) showed reinsurance cycles and government intervention can quickly reverse short positions. Be wary of binary government backstops that can cap insurer losses and shorts.
