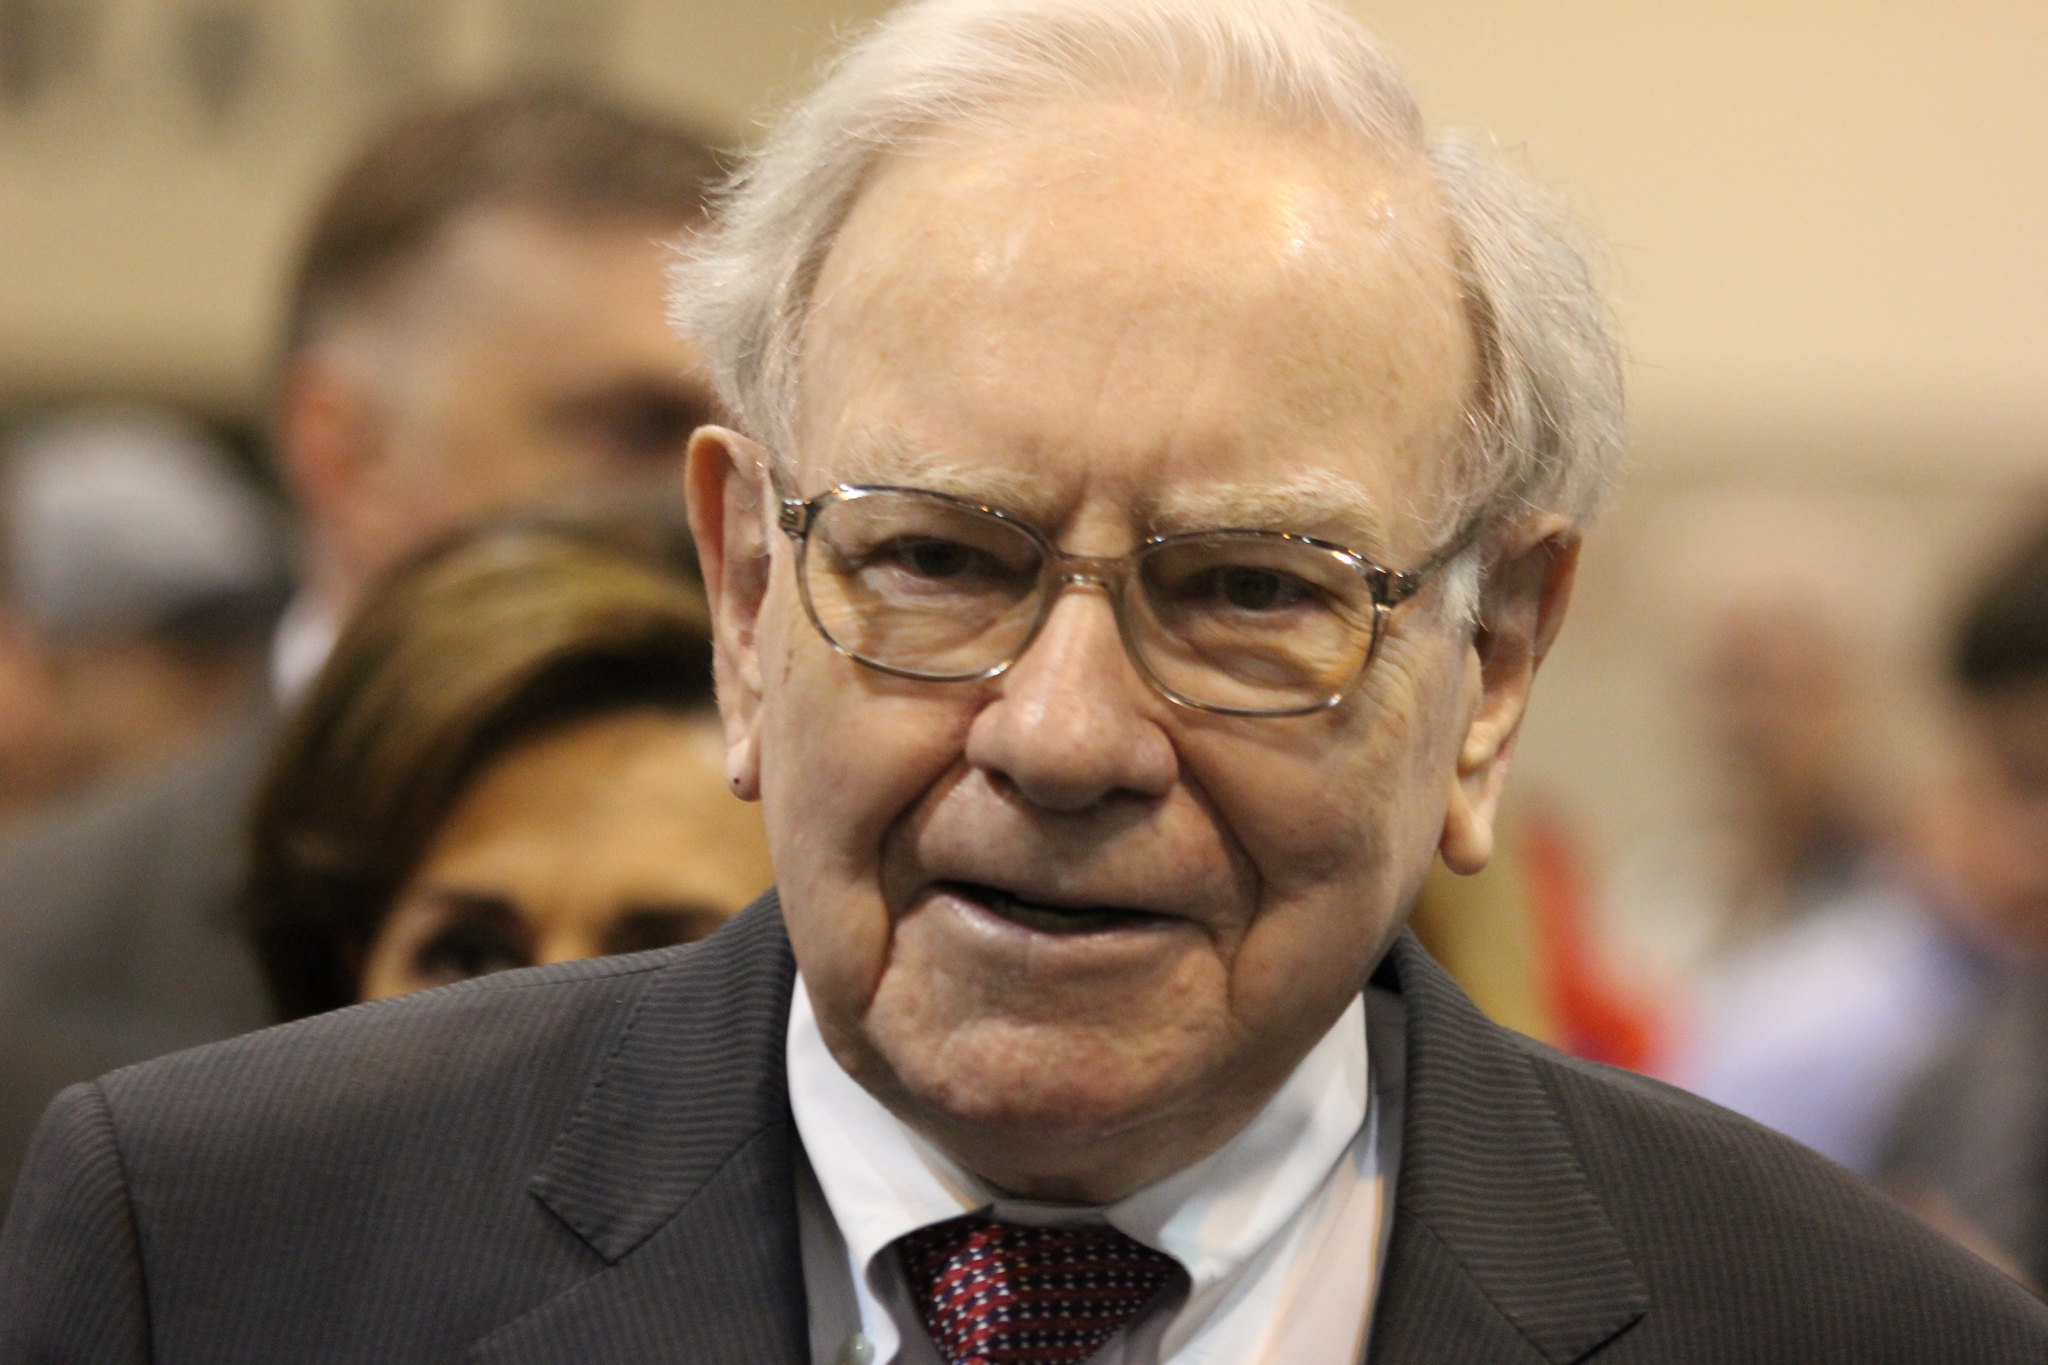
Warren Buffett's favored 'Buffett indicator,' measuring total U.S. stock market capitalization against GDP, has reached an all-time high of over 216%. This level significantly surpasses the 200% threshold Buffett previously warned indicated 'playing with fire' before the dot-com bubble, prompting concerns about market overvaluation despite recent strong GDP growth. Berkshire Hathaway's current conservative posture, characterized by stock sales and record cash accumulation, further suggests a cautious outlook, implying institutional investors should heed potential risks.
Over many decades of investing, Warren Buffett and his conglomerate, Berkshire Hathaway (BRK.A 0.80%) (BRK.B 0.68%), have beaten the broader stock market time and again. His core investing principles have stood the test of time. Market analysts and experts are currently divided on whether the market is overvalued or if it's in the middle of an artificial intelligence-driven supercycle. But based on one metric that Buffett has historically used to gauge where the stock market is in its cycle, the answer couldn't be any clearer. "You are playing with fire" Warren Buffett has relied on one metric so much in the past that investors dubbed it "the Buffett indicator." It essentially looks at the value of the whole U.S. stock market by market cap compared to the U.S. gross domestic product (GDP). For the market cap of the stock market, Buffett uses the Wilshire 5000, which essentially looks at the collective market cap of all U.S. stocks. GDP is the value of all the goods and services produced by labor and property in the U.S. In a 2001 interview with Fortune, he described this metric as "probably the best single measure of where valuations stand at any given moment." Interestingly, U.S. GDP has come in strong lately. The Commerce Department just revised its second-quarter GDP growth result up by 0.5 percentage points to 3.8%, the highest quarterly number in about two years. Regardless, the Buffett indicator now stands at over 216%, an all-time high and well beyond levels that Buffett previously expressed concern about. SNPINDEX: ^GSPC Key Data Points In the past, he has said that the stock market is overvalued when the Buffett indicator is over 100%, but keep in mind that it hasn't been below that level in 12 years, so that concept could be outdated at this point. Still, when it gets above 200%, Buffett has previously expressed significant concern: If the percentage relationship falls to the 70% or 80% area, buying stocks is likely to work very well for you. If the ratio approaches 200% -- as it did in 1999 and a part of 2000 -- you are playing with fire. The dot-com bubble ended in flames, so even though he made this warning to Wall Street a long time ago, it's hard to ignore it today, especially when Berkshire Hathaway has been so conservative about buying stocks in recent years. Berkshire has actually sold a significant volume of shares and piled up a record amount of cash. It has even been reluctant to repurchase its own stock. All of this suggests that Buffett may well have similar concerns today as he did back when discussing the dot-com bubble. A lot has changed Make no mistake, a lot has changed over the years, as evidenced by the consistently high levels of the Buffett indicator. For one, the Federal Reserve has implemented an enormous amount of quantitative easing, which effectively pumped money into the economy and helped inflate the value of assets from homes to stocks. It's also possible that the AI boom differs from the first dot-com boom, largely because capital expenditures this time are being funded by extremely profitable companies that appear too big to fail. That said, Buffett and Berkshire have done almost as good of a job at avoiding major market meltdowns as they have at picking winning stocks and acquisitions, so their warnings shouldn't be taken lightly. Retail investors with long-term investing horizons can keep buying the broader benchmark S&P 500 index, but this is a good time to remember that the market's generally upward path is not linear. That's why using a dollar-cost averaging strategy, which smooths out your cost basis over time, makes particularly good sense in times like these. The 'Buffett indicator,' which measures total U.S. stock market capitalization against GDP, has reached an unprecedented level of over 216%, an all-time high. This figure significantly surpasses the 200% threshold that Warren Buffett historically flagged as a sign of extreme overvaluation, famously describing it as 'playing with fire' prior to the dot-com bubble collapse. This cautionary signal is amplified by Berkshire Hathaway's current defensive posture, which includes significant net sales of equities and the accumulation of a record cash position. While the market's high valuation is juxtaposed with strong recent economic data, such as a revised Q2 GDP growth of 3.8%, and arguments that structural changes like quantitative easing and an AI-boom funded by profitable companies may justify new valuation paradigms, Buffett's track record in risk management and Berkshire's current actions suggest a deeply cautious outlook on current market levels.
AI-powered research, real-time alerts, and portfolio analytics for institutional investors.
Request DemoOverall Sentiment
strongly negative
Sentiment Score
-0.70
Ticker Sentiment
