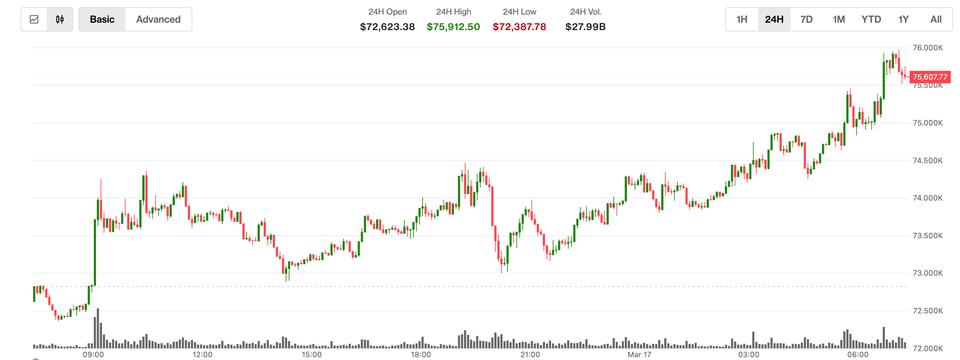
Bitcoin surged above $75,000 to a high of $75,800, decisively breaking the long-term $73,750–$74,400 resistance zone; CoinDesk attributes the rally largely to unwinding of bearish put-option hedges around $55,000–$60,000. The unwind reduced downside hedging pressure and forced market makers to buy BTC, lifting the broader crypto market (CoinDesk 20 Index +5%); ether rose ~8% to $2,360, and major altcoins including XRP and SOL posted strong gains. XRP has reclaimed the No. 4 market cap spot at about $93.4B and $1.53, with Binance futures open interest up ~59% since October to ~353M XRP, signaling rebuilt leverage as it tests $1.50–$1.60. Monitor options open interest and market-maker hedging flows for potential continuation or reversal risk if leveraged positions fail to hold.
The recent advance looks like a pure derivatives microstructure event: dealers buying spot to neutralize sold put exposure created a one-way flow that compressed implied volatility and amplified price discovery. That flow is finite and concentrated around specific expiries — once those expiries clear, the mechanical bid can fade quickly, leaving price vulnerable if real-money demand (long-dated calls, institutional flows) does not step in to replace it.
Cross-asset spillovers are already visible: altcoins have been swept higher by cross-margin and cross-gamma effects, which temporarily amplifies correlation and funds’ willingness to recapitalize levered positions. That creates a classic fragility — rising futures open interest and leveraged long builds provide fuel for outsize mean reversion if a volatility shock or a single large liquidation event reverses dealer hedging from buying to selling.
For positioning, time horizon is everything. Over days-to-weeks you can trade around the expected decompression of dealer flow (fade near-term moves post-expiry), while over months you should require evidence of sticky structural flows (institutional-led demand, persistent call buying, or ETF-like net inflows) before removing tail hedges. Monitor dealer vega and gamma footprints, futures OI, and skew steepness as real-time triggers rather than price levels alone.
AI-powered research, real-time alerts, and portfolio analytics for institutional investors.
Overall Sentiment
moderately positive
Sentiment Score
0.60
Ticker Sentiment