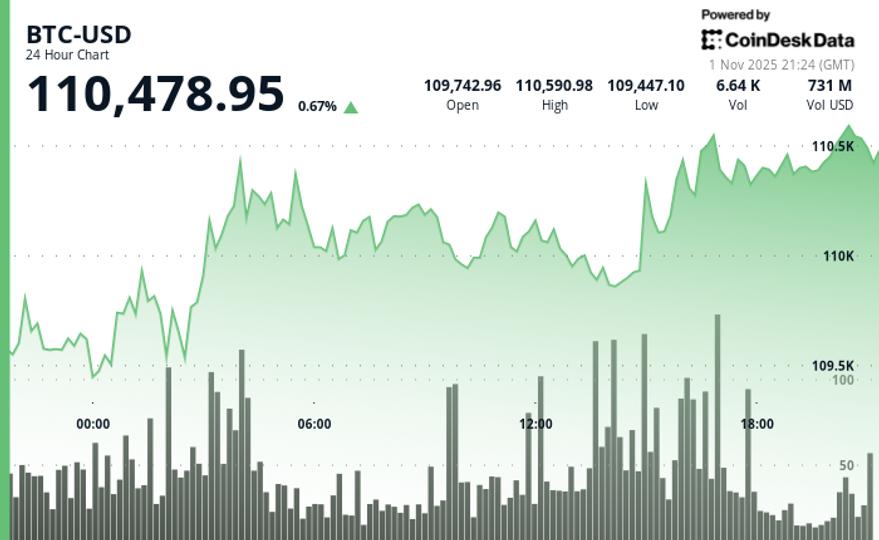
While a popular narrative suggests November is Bitcoin's strongest month with an average 42.5% gain, a closer analysis reveals this figure is heavily skewed by a single 449% outlier in 2013. Excluding this anomaly, the median November return is a more modest 8.81%, indicating typical monthly performance is significantly lower and highly variable, with historical data showing both substantial gains and losses. This distinction between mean and median highlights that seasonality should be considered context rather than a definitive trading signal for Bitcoin.
A common market narrative suggesting November is Bitcoin's strongest month, with an average gain of 42.5%, is significantly skewed by a single outlier event: a +449% rally in 2013. A more accurate representation of typical November performance, the median return, stands at a considerably lower 8.81%. This distinction between mean and median highlights the distorting effect of extreme historical events on aggregate statistics.
Historical data for November reveals substantial volatility, encompassing both significant gains and deep losses. Examples include gains of +42.95% in 2020 and +37.29% in 2024, contrasted with losses of -36.57% in 2018, -17.27% in 2019, and -16.23% in 2022. This wide spread underscores that November's performance is far from consistently bullish.
In comparison, October exhibits a stronger historical profile with an average return of +19.92% and a median of +14.71%. The analysis concludes that while seasonality provides context, it should not be interpreted as a definitive trading signal. Professional traders typically seek confirmation through real-time price chart analysis, such as breakthroughs in resistance levels, improving market breadth, and higher trading volumes, rather than relying solely on historical seasonal patterns.
AI-powered research, real-time alerts, and portfolio analytics for institutional investors.
Overall Sentiment
neutral
Sentiment Score
0.00
Ticker Sentiment
