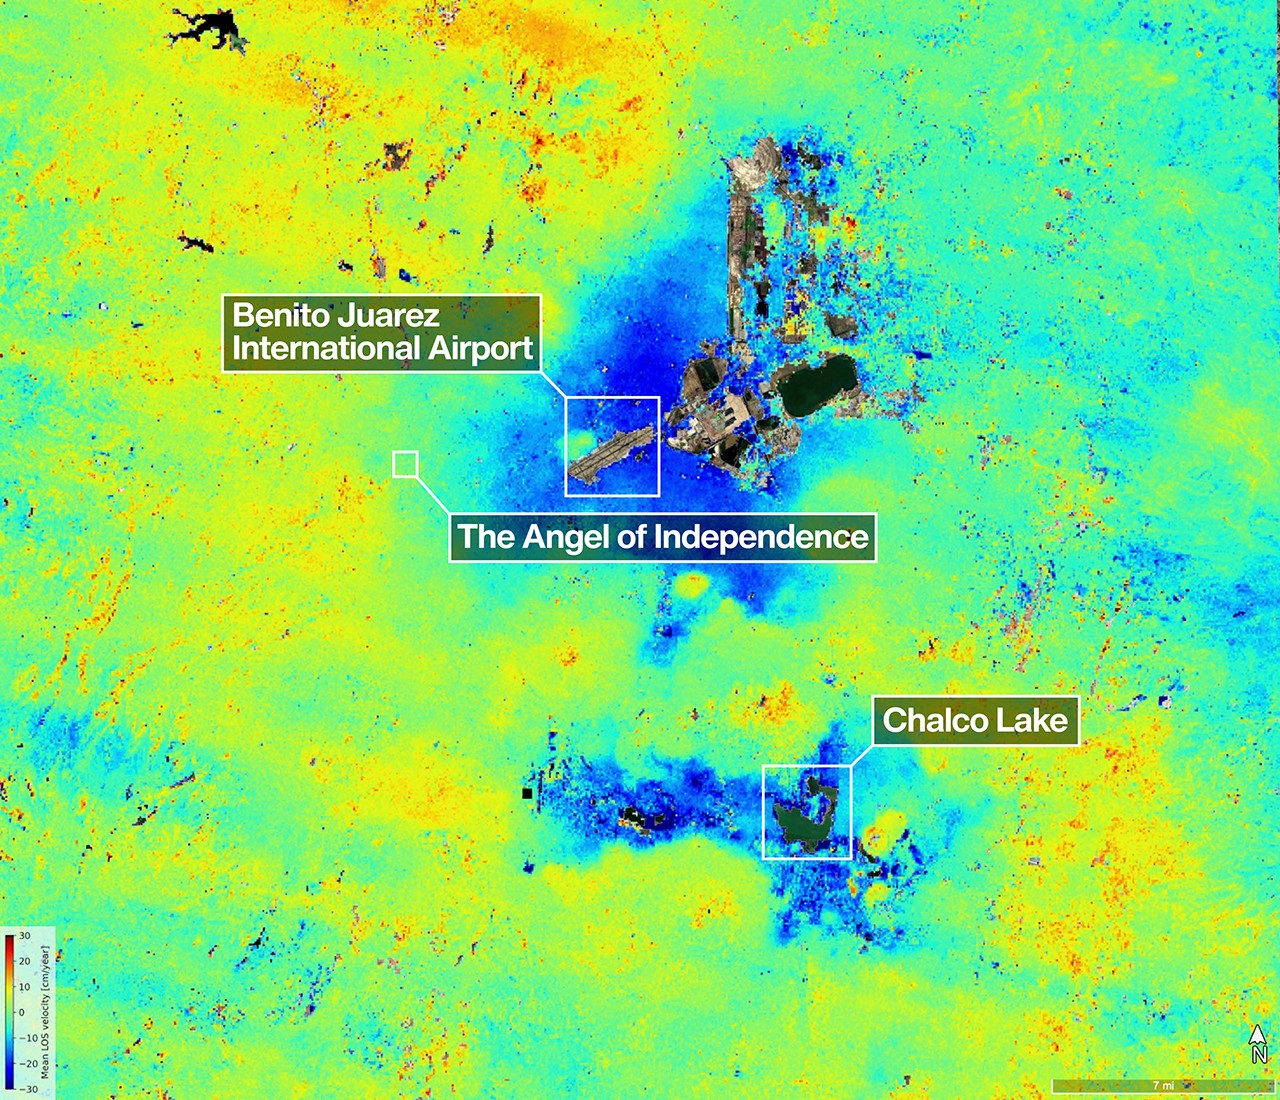
NISAR's first-year data show land subsidence in Mexico City of more than half an inch (over 2 cm) per month in dark blue areas, confirming the satellite is performing as expected. The article highlights the mission's dual L- and S-band radar capabilities and their applications for monitoring cities, agriculture, ecosystems, and disaster response. The impact is informational rather than market-moving.
The investable read is not the subsidence itself; it is the conversion of geophysics into underwriting advantage. A satellite product that can repeatedly quantify deformation at city scale should improve hazard pricing for insurers, infrastructure lenders, utilities, and sovereign/muni credit, especially in markets where ground truth is sparse and historical losses are underreported. The first-order beneficiary is any platform that can ingest this data early and turn it into property-level, route-level, or asset-level risk scoring before the market fully re-rates exposure.
The second-order effect is a likely widening gap between headline-safe and technically-safe assets. Assets in subsidence corridors can look fine on a conventional map while silently accumulating maintenance capex, water management costs, and business interruption risk over 12-36 months. That matters for airports, rail, telecom towers, district water systems, and industrial parks; the weak point is not collapse but chronic service degradation that shows up as margin pressure and capex creep long before a disaster headline.
The contrarian takeaway is that this is bullish for monitoring and remediation, not broadly bearish for the city or country. Better remote sensing can actually reduce tail risk by enabling targeted intervention, which may cap worst-case losses and improve insurability for assets that otherwise would be unpriceable. The market likely underestimates the duration over which subsidence becomes a recurring maintenance tax rather than a binary event, which favors long-duration beneficiaries of geospatial analytics and smart infrastructure over event-driven disaster trades.
Catalyst-wise, the next 3-9 months should see a wave of validation use cases as the mission accumulates enough passes to lower noise and improve actionable resolution. The trade is therefore on adoption rather than the map itself: if governments, reinsurers, and infrastructure operators start referencing this data in filings, permitting, or capital plans, it becomes a leading indicator for budget reallocations into water management, resilient construction, and monitoring software.
AI-powered research, real-time alerts, and portfolio analytics for institutional investors.
Request DemoOverall Sentiment
neutral
Sentiment Score
0.10