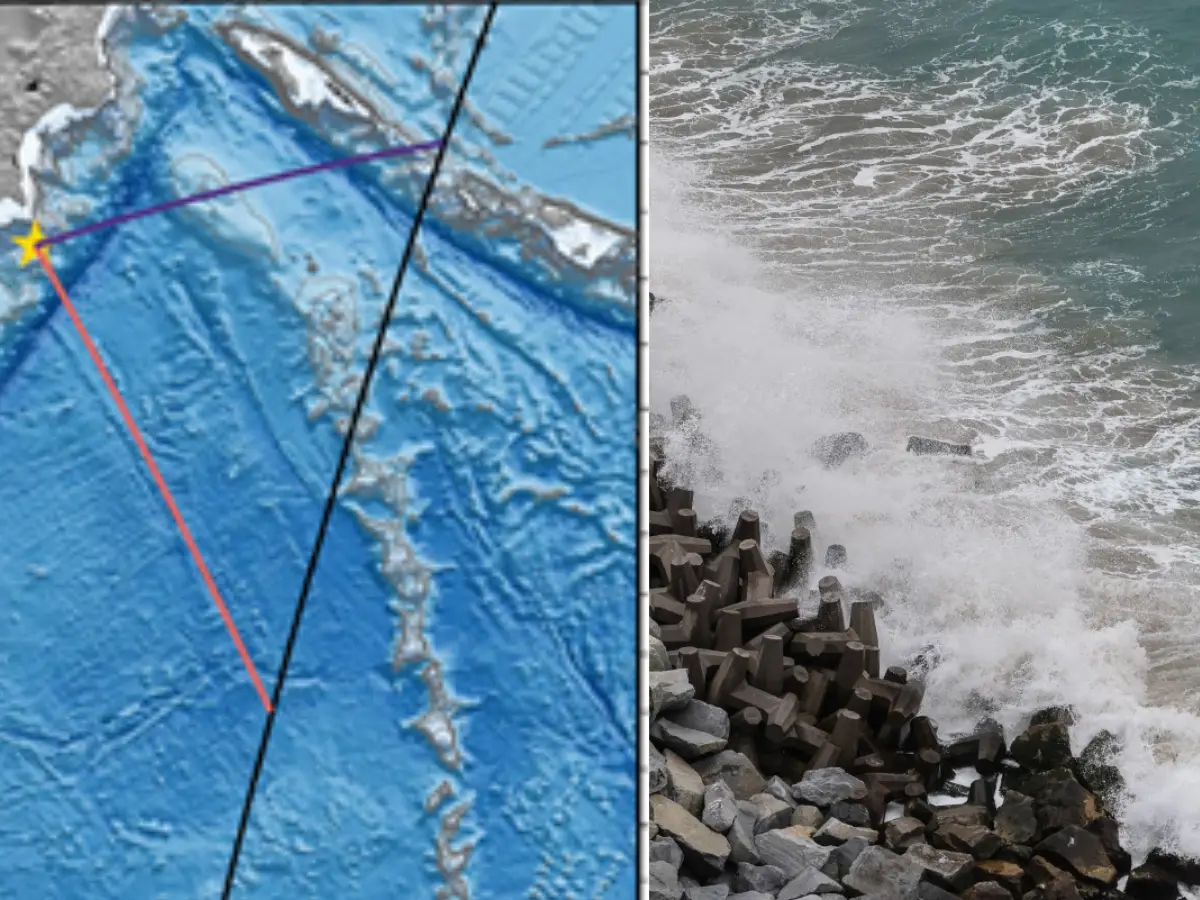
An 8.8-magnitude earthquake off Russia's Kamchatka Peninsula in 2025 generated giant tsunami waves that were captured from space by NASA's SWOT satellite and corroborated by NOAA DART deep-ocean tsunami buoys. Researchers mapped a roughly 402 km rupture with up to 13 feet (~4 m) of seafloor uplift and a 120-km-wide wave signature; their analysis, published in Seismic Recordings (Nov 2025), suggests the 1952 magnitude-9 event did not fully release fault stress, challenging long-held recurrence assumptions for the region and carrying implications for coastal hazard assessment and infrastructure risk modelling.
Market structure: The immediate winners are satellite-imagery and ocean-monitoring equipment providers (e.g., MAXR, PL, TDY) and large defense primes (LMT, NOC) that can win NOAA/DOI/DoD contracts to expand DART-like networks; expect government procurement budgets to reallocate ~+5–15% to ocean surveillance over 12–24 months. Losers are small, low-margin imagery pure-plays and uninsured coastal infrastructure owners; pricing power shifts to vertically integrated players that combine hardware, data analytics and government certifications. Cross-asset: modest upward pressure on long-duration sovereign yields if governments front-load spending (~$5–10bn incremental program scale), slight FX tailwinds for NOK/SEK/JPY if regional repair/import activity rises, and renewed bid for catastrophe reinsurance and cat bonds tightening spreads.
Risk assessment: Tail risks include a nearby major coastal strike causing large insured losses (low prob, high impact) that would surge reinsurance rates and credit spreads across insurers in weeks; regulatory risks include tightened export controls on high-resolution data within 30–90 days. Immediate (days): market noise and headline-driven flows; short-term (weeks–months): RFP cycles and budget announcements; long-term (1–3 years): capex cycles for sensors and buoy networks. Hidden dependency: procurement cycles hinge on politics and inter-agency budgets — contract awards may cluster and favor incumbents. Catalysts: Congressional appropriations, major contract awards, or another seismic event.
Trade implications: Direct plays: favor 6–12 month overweight in MAXR/PL and TDY, and selective exposure to LMT/NOC for systems integration; size 0.5–2% positions per name. Pair trades: long MAXR vs short smaller imagery ticker BKSY to capture scale benefits; horizons 9–18 months. Options: use 6–12 month call spreads (buy ATM, sell 20% OTM) to capture upside while capping premium outlay; target IV entry after earnings/contract windows. Sector rotation: shift 2–5% from coastal REITs/SMB insurers into satellites/defense and reinsurance equities as a hedge.
AI-powered research, real-time alerts, and portfolio analytics for institutional investors.
Request DemoOverall Sentiment
neutral
Sentiment Score
0.00
Contrarian angles: Consensus will either underreact (no immediate coastal damage -> complacency) or over-rotate into every imagery stock; the durable read-through is procurement-led, not immediate revenue, so multi-quarter conviction is needed. Historical parallel: post-2011 Tohoku saw multi-year investment in sensors and building codes — expect a similar 12–36 month procurement and capex uplift, favoring incumbents with certification. Unintended consequence: a rush into imagery could compress pricing for commodity imagery, benefiting integrated analytics providers and defense primes while marginalizing small-cap imagers.
