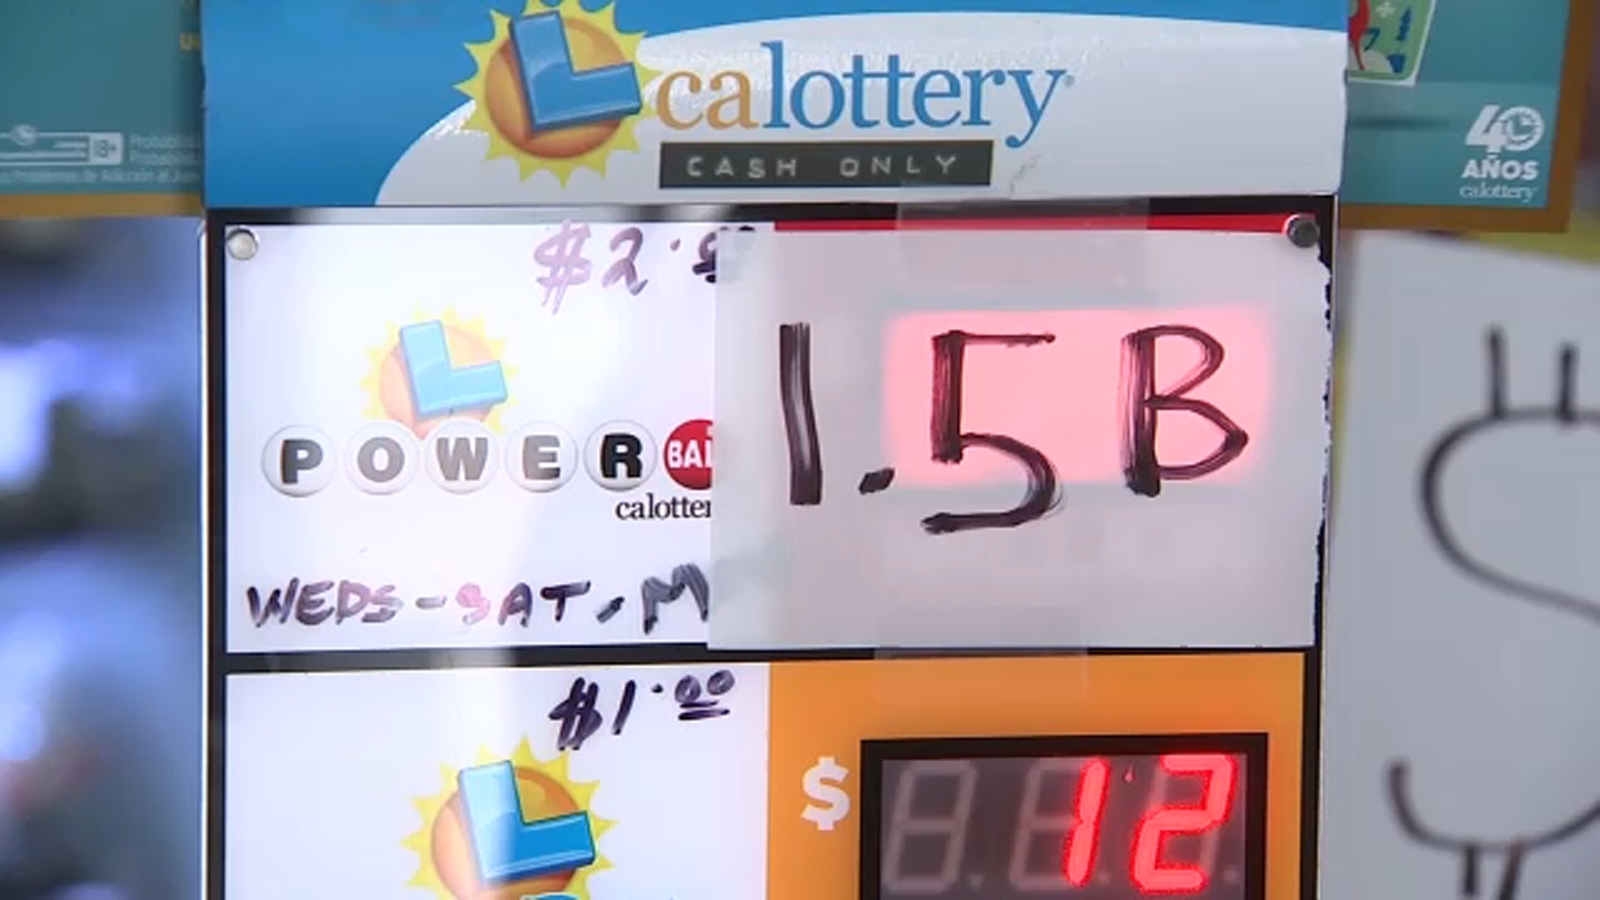
The Powerball jackpot has reached $1.5 billion — the fifth-largest prize in the game's history — with the advertised annuity averaging about $30 million a year for 30 years and the lump-sum cash option roughly $686 million before taxes. There has been no jackpot winner since September, when two tickets split a $1.7 billion prize, and the official odds of winning remain 1 in 292.2 million. While notable for consumer interest and retail lottery sales, this development has negligible direct implications for financial markets or institutional investors.
Market structure: A $1.5bn Powerball draws a concentrated, short-lived demand spike that primarily benefits retail lottery retailers (c-stores, grocery chains), payment processors and broadcast partners through higher foot traffic and ad eyeballs over 48–72 hours. Expect ticket sales to lift same‑week comps by a modest measurable amount (typical historical spikes range from +5% to +20% for lottery product lines), but this is transient and will not shift long‑run category market share or pricing power.
Risk assessment: Tail risks are regulatory (state-level tax hikes, anti-gambling measures) and AML/screening scrutiny if large cash flows concentrate in a few jurisdictions — low probability but high impact for lottery-dependent state revenues. Time horizons: immediate distortion (days) of retail sales and media ratings, short-term (weeks) potential headline-driven volatility in small retail names, and negligible long-term macro impact unless legislative change occurs within 30–90 days.
Trade implications: Tactical, size-constrained plays are appropriate: short-dated option exposure to retailers and selective tiny equity exposure to convenience-store operators capture the weekend bump while capping downside. Avoid reallocating core bond/equity risk based on the jackpot; only material policy changes (e.g., state tax increase >2% enacted) would justify reweighting in quarters ahead.
Contrarian angles: Consensus treats this as pure retail theater — the miss is underestimating headline-driven retail microstructure (temporary basket rebalancing, higher in‑store basket size). Reaction is likely overdone in single-day sentiment for mid‑caps; look for mean reversion 3–7 trading days post-draw and avoid levering into weekend narratives.
AI-powered research, real-time alerts, and portfolio analytics for institutional investors.
Request DemoOverall Sentiment
neutral
Sentiment Score
0.00
