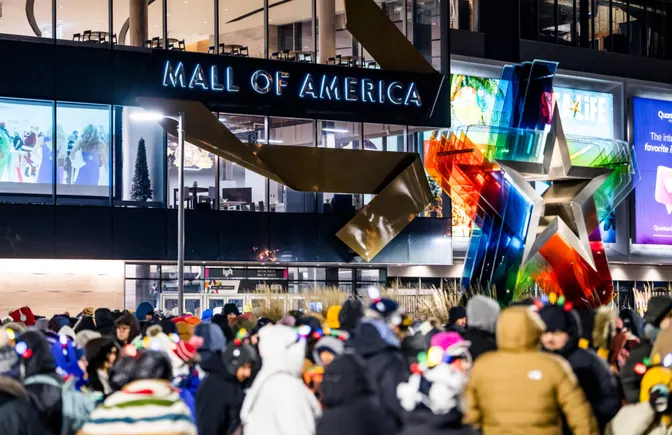
Black Friday produced mixed signals: Adobe Analytics reported U.S. e‑commerce sales of $11.8B (+9.1% YoY) while Salesforce put online Black Friday sales at $18B (+3% YoY) and Shopify POS offline U.S. sales rose 26% YoY. However, online order volume fell 1% with average selling prices up 7% and units per transaction down 2%, discounts remained roughly flat (peak U.S. discounts ~28%), AI-driven traffic surged (Adobe: +805%) and drove an estimated $3B in sales, and buy‑now‑pay‑later use rose 8.9% to $747.5M—signaling retailers saw headline growth but consumers remain stretched and comparisons will be clouded by 2024 election effects.
Market structure: Winners are AI platform and analytics providers (ADBE, CRM) and omni-channel retailers that can create exclusive in-store perks (TGT, LOW) because AI-sourced traffic was up 805% and drove roughly $3B in U.S. sales on Black Friday; losers are volume-dependent e-commerce players and apparel specialists as online order volume fell 1% while average selling price rose 7%, implying mix/inflation not unit-led growth. Competitive dynamics: Pricing power is fragmented — similar headline discounts (peak ~28%) compress differentiation, so share shifts will favor retailers that monetize traffic or offer differentiated experiences rather than lowest price. Supply/demand: unit weakness implies demand elasticity at current price points; BNPL grew 8.9% to $747.5M, signaling demand being pulled forward via credit but increasing future repayment tail risk. Cross-asset: weaker consumer volumes and higher ASPs raise default risk that could pressure credit spreads and bank equity, lift consumer credit CDS, and increase downside skew in retail/options markets; modest downward pressure on USD if CPI softness follows, while discretionary-sensitive commodities (cotton, pulp) see muted demand.
Risk assessment: Tail risks include a post-holiday spike in BNPL/credit delinquencies (>150bps QoQ increase in 90+ day delinquencies) and regulatory actions on BNPL or AI data usage that could hit monetization; an election-year muddle could further depress discretionary spending. Time horizons: immediate (next 30–60 days) — monitor returns, charge-offs, and post-holiday sales revisions; short-term (Q4 reporting season) — watch comps and inventory write-downs; long-term (12–24 months) — AI monetization cadence and BNPL loss rates. Hidden dependencies: inventory positions, merchant-funded promotions, and mobile-driven BNPL mix (80.7% mobile share) create nonlinear P&L exposures. Catalysts: Dec–Jan returns/revenue, CPI/consumer credit prints, and any BNPL regulation in 90 days would accelerate trend reversals.
Trade implications: Favor software/AI monetizers — establish a 2–3% long ADBE position (3–9 month horizon) to capture ad/commerce analytics upside; hedge with a 5–10% OTM 3-month put. Add 1–2% long CRM for agentic service monetization ahead of FY results and a 1% long SHOP to play POS recovery vs. pure e-commerce. Reduce exposure to apparel/online-only retailers by 3–5% and implement a paired trade long TGT (1–2%) / short XRT equal notional (3–6 month horizon) to capture in-store differentiation. Use options: buy a 3-month SPX 5%-10% put spread sized to 0.5–1% portfolio as a macro retail-tail hedge; trim if CPI YoY <3% or 90+ day delinquencies do not rise >50bps.
Contrarian angles: The market may be underestimating stickiness of AI-driven conversion (38% higher conversion from AI referrals) — ADBE/CRM upside could be underpriced if third-party AI agent channels scale beyond current $3B/day effect into 2026. Conversely, consensus may be underpricing BNPL credit losses; a <2% rise in overall consumer delinquency would likely be benign, but a >150bps jump would be catastrophic for small-cap retailers. Historical parallels (post-promotional shakeouts) show the holiday season often accelerates retailer consolidation — expect margin compression for specialty apparel and concentration gains for big-box and platform players. Unintended consequence: rapid AI/agent adoption can increase returns and CAC, diminishing topline elasticity if personalization fails to reduce discount dependency.
AI-powered research, real-time alerts, and portfolio analytics for institutional investors.
Request DemoOverall Sentiment
mildly negative
Sentiment Score
-0.25
Ticker Sentiment
