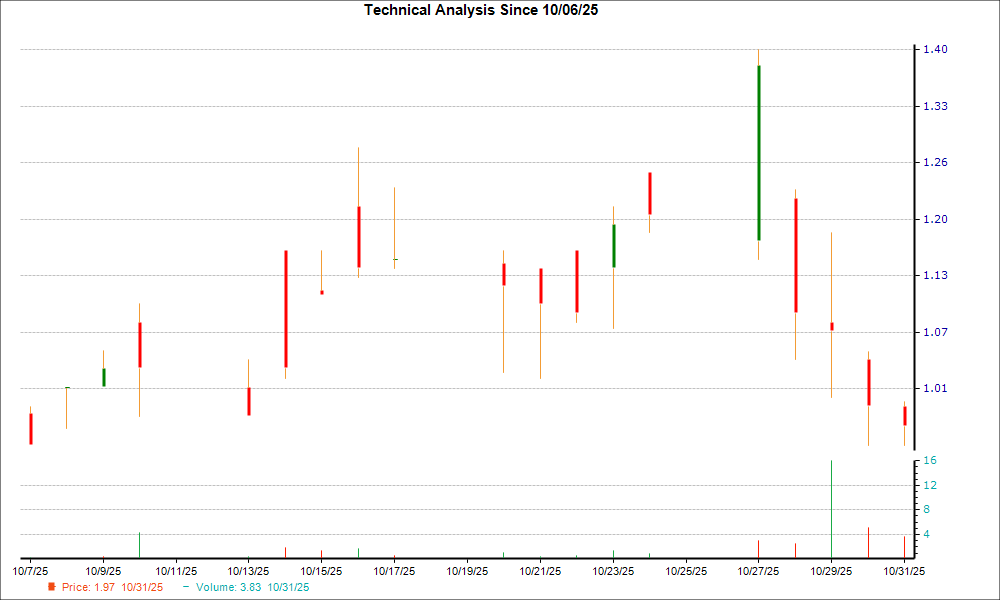
Innate Pharma (IPHA), having recently experienced a 12.1% decline, is showing signs of a potential trend reversal, marked by the formation of a 'hammer chart pattern' indicating a technical bottom. This technical signal is supported by fundamental improvements, as Wall Street analysts have collectively raised the current year's consensus EPS estimate by 1.5% over the past 30 days, contributing to IPHA's Zacks Rank #2 (Buy) and suggesting strengthening prospects.
Innate Pharma (IPHA) has recently experienced a significant downtrend, with its stock declining 12.1% over the past week. However, the formation of a 'hammer chart pattern' in its latest trading session suggests a potential technical bottom and a subsiding of selling pressure. This pattern indicates that bulls successfully counteracted bears, helping the stock find support.
This technical signal is corroborated by strengthening fundamental indicators. Over the last 30 days, Wall Street analysts have collectively raised the consensus EPS estimate for IPHA's current year by 1.5%. This upward revision signifies a strong agreement among sell-side analysts regarding improved earnings prospects.
Further bolstering the bullish case, IPHA currently holds a Zacks Rank #2 (Buy). This ranking places it within the top 20% of stocks based on earnings estimate revisions and EPS surprises, historically indicating potential market outperformance. The combination of a technical reversal pattern and positive fundamental revisions suggests an improving outlook for the stock.
AI-powered research, real-time alerts, and portfolio analytics for institutional investors.
Request DemoOverall Sentiment
strongly positive
Sentiment Score
0.70
Ticker Sentiment
