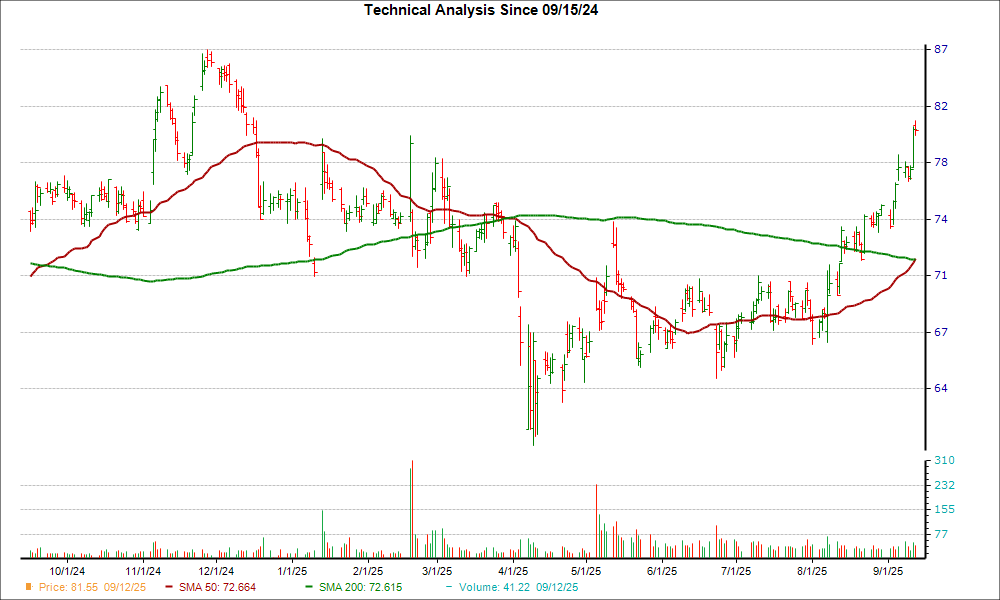
Howard Hughes Holdings (HHH) has triggered a 'golden cross' technical signal, as its 50-day simple moving average crossed above its 200-day SMA, which typically indicates a bullish breakout. This technical development is reinforced by the stock's 10.6% gain over the past four weeks, a #1 (Strong Buy) Zacks Rank, and recent positive earnings estimate revisions for the current quarter, collectively suggesting potential for further upside.
Howard Hughes Holdings Inc. (HHH) is exhibiting a confluence of bullish signals, headlined by a significant technical event known as a 'golden cross', where its 50-day simple moving average has surpassed its 200-day simple moving average. This indicator is often interpreted as signaling a potential trend reversal and the beginning of a sustained upward move. The technical signal is reinforced by recent price momentum, with HHH shares appreciating 10.6% over the past four weeks. Further supporting a positive outlook, the stock carries a #1 (Strong Buy) rating from Zacks. This rating is complemented by an upward revision in the Zacks Consensus Estimate for the current quarter, which, according to the report, suggests a strengthening earnings outlook despite no individual analyst estimate changes in the past 60 days. The combination of a key technical breakout, positive price momentum, a top-tier analyst rating, and favorable earnings estimate trends presents a compelling, multi-faceted case for bullish sentiment surrounding the stock.
AI-powered research, real-time alerts, and portfolio analytics for institutional investors.
Request DemoOverall Sentiment
strongly positive
Sentiment Score
0.85
Ticker Sentiment
