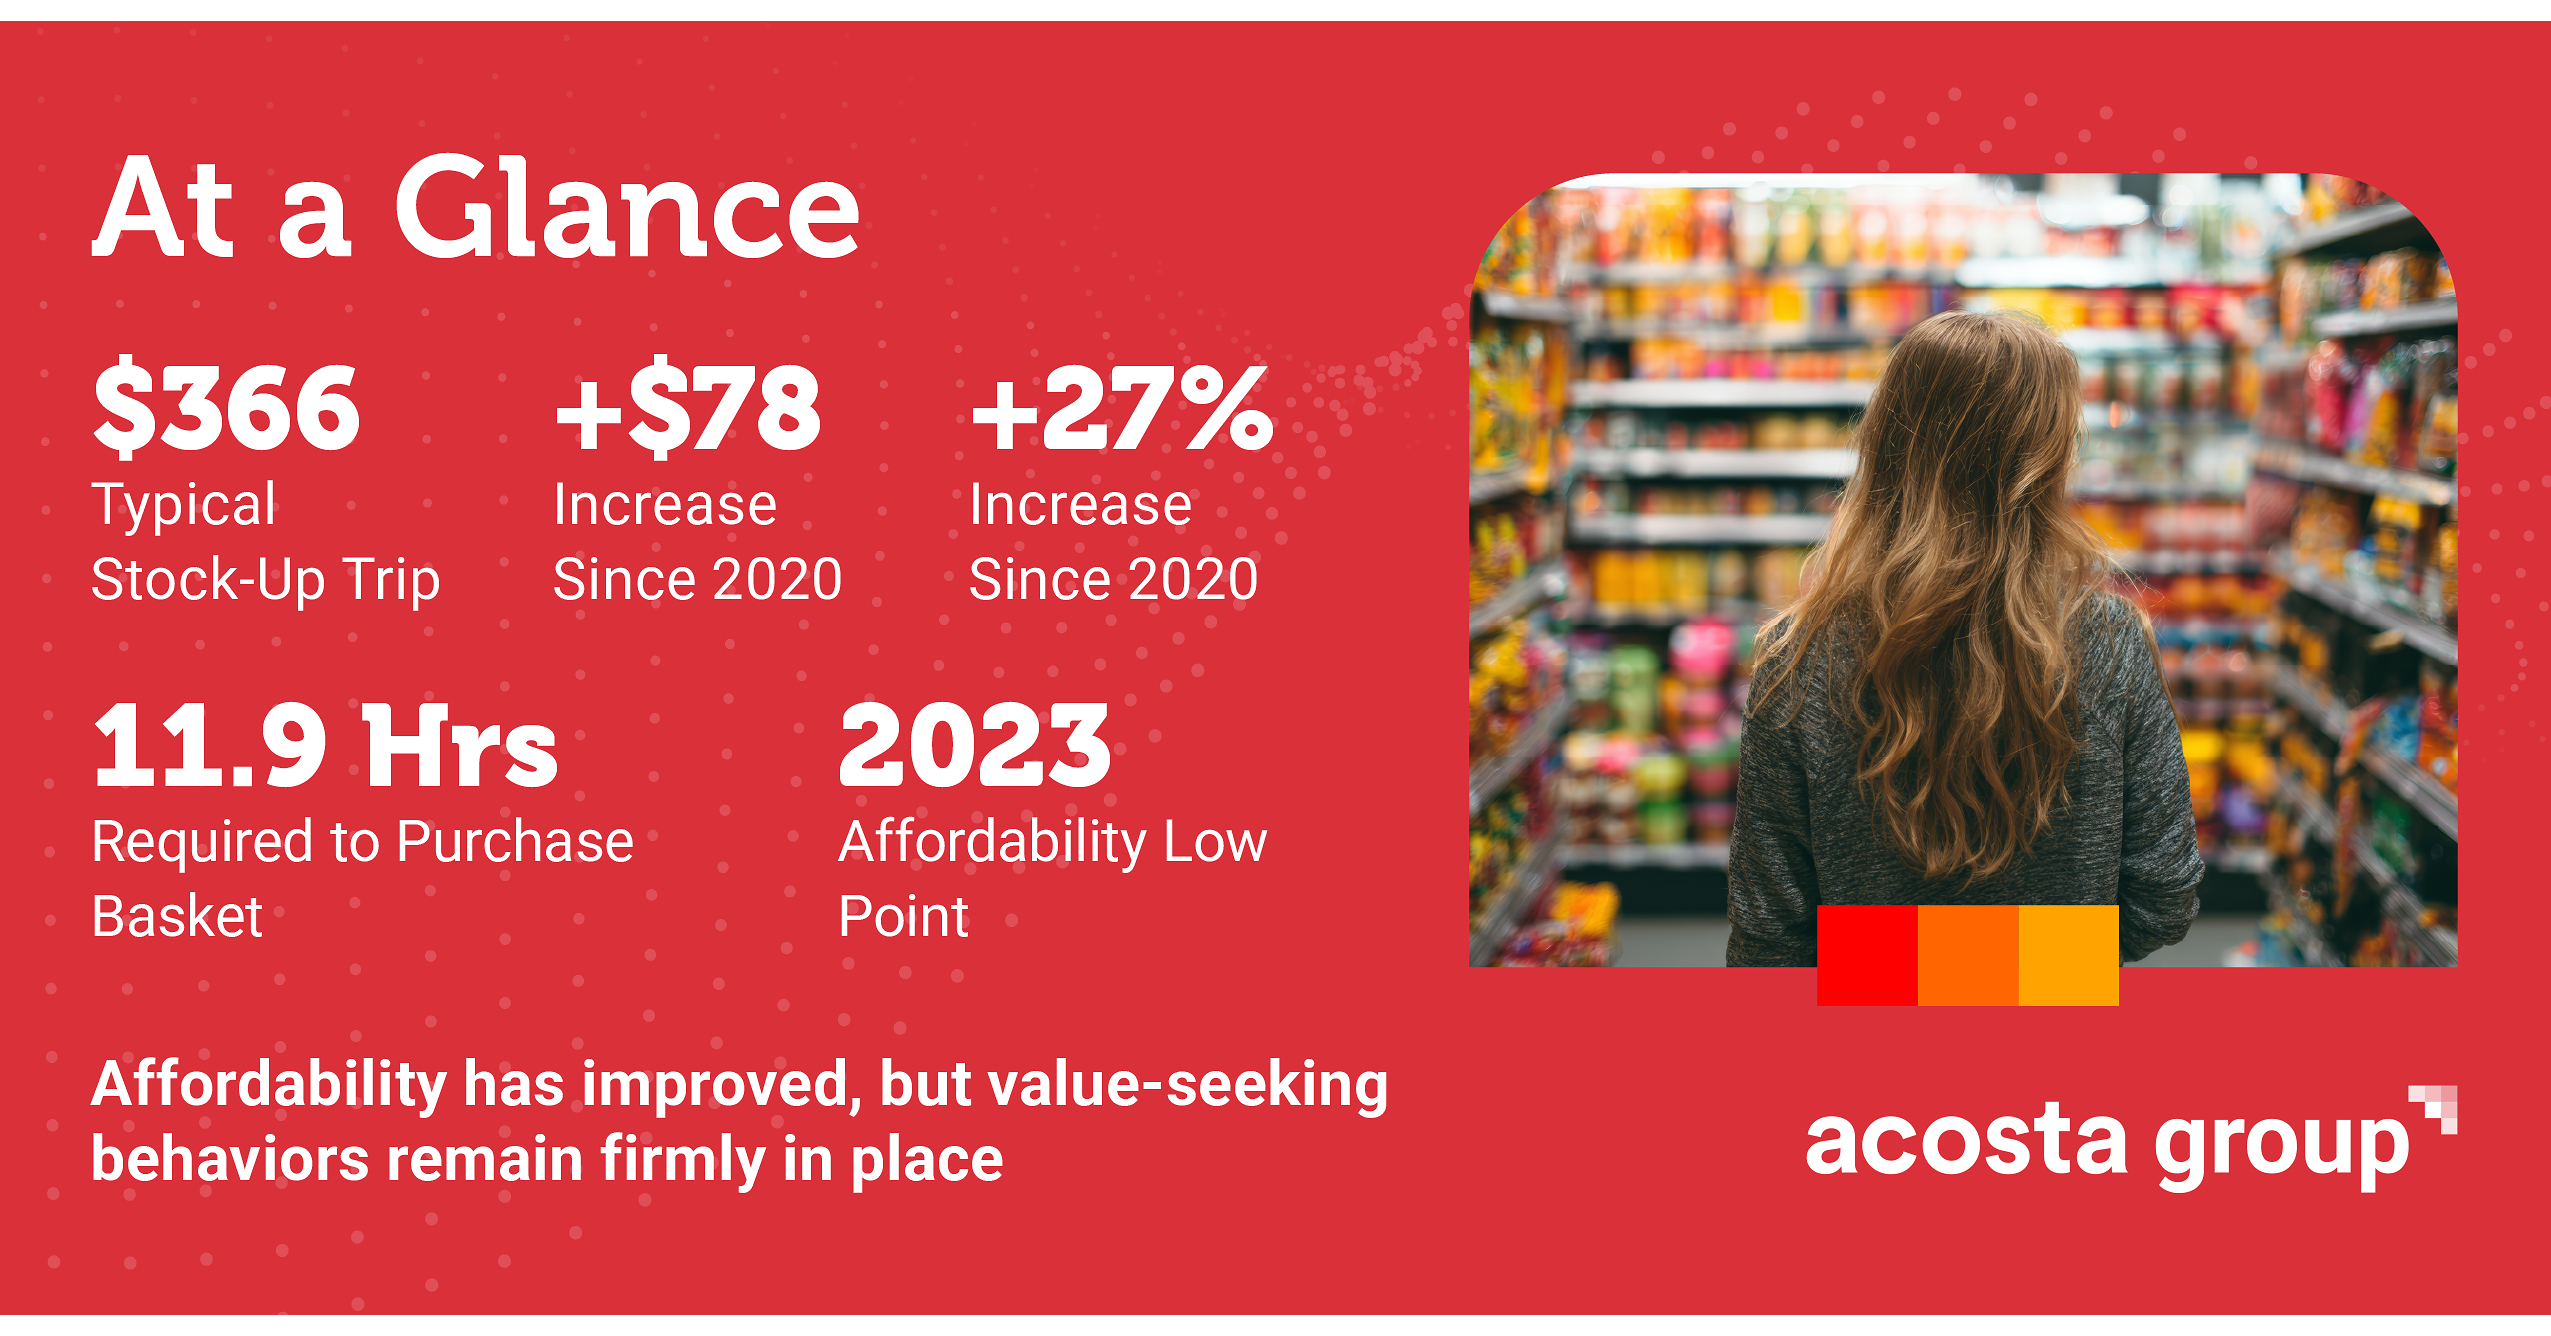
Acosta Group’s inaugural Affordability Tracker finds the typical “stock-up trip” now costs over $366, about 27% higher than in 2020, even as wage growth has partially restored grocery purchasing power since the 2023 inflation low. However, consumers’ inflation-era behaviors—higher promo engagement, stronger price awareness, and more deliberate spending scrutiny—remain firmly in place, and affordability recovery is described as largely stabilized. The report suggests improving grocery affordability alone may not reverse value-seeking shopping patterns, implying ongoing pressure from housing, insurance, healthcare, and other essentials.
This reads less like a one-time “inflation is easing” signal and more like evidence that the consumer has structurally rewired around value. That is a negative for branded CPGs and mid-tier grocers that depend on loyalty and mix stability: even if nominal affordability improves, households are still optimizing baskets, which means more promo funding, more private-label substitution, and slower price realization. The first-order winners are scale retailers with strong price perception and membership/loyalty data — they can keep traffic while flexing margin discipline — but the second-order winner may be retail media and trade-spend efficiency tools, because brands will have to pay to defend share.
Over the next 1-3 months, the market will likely focus on whether this shows up in scanner data and Q2/Q3 margin commentary rather than the survey itself. The key risk is that many staples names are still implicitly underwriting a return to pre-2021 shopping behavior; if that doesn’t happen, volume recovery may stay weak even as top-line inflation normalizes. The contrarian view is that the move may be underappreciated, not overdone: this is not just “consumers are still cautious,” it implies a longer-duration mix shift that can suppress branded gross margins for 6-18 months. What would falsify it is clear evidence of basket-size normalization, lower promo intensity, and improving unit velocity without incremental trade spend.
AI-powered research, real-time alerts, and portfolio analytics for institutional investors.
Request DemoOverall Sentiment
mildly negative
Sentiment Score
-0.18
