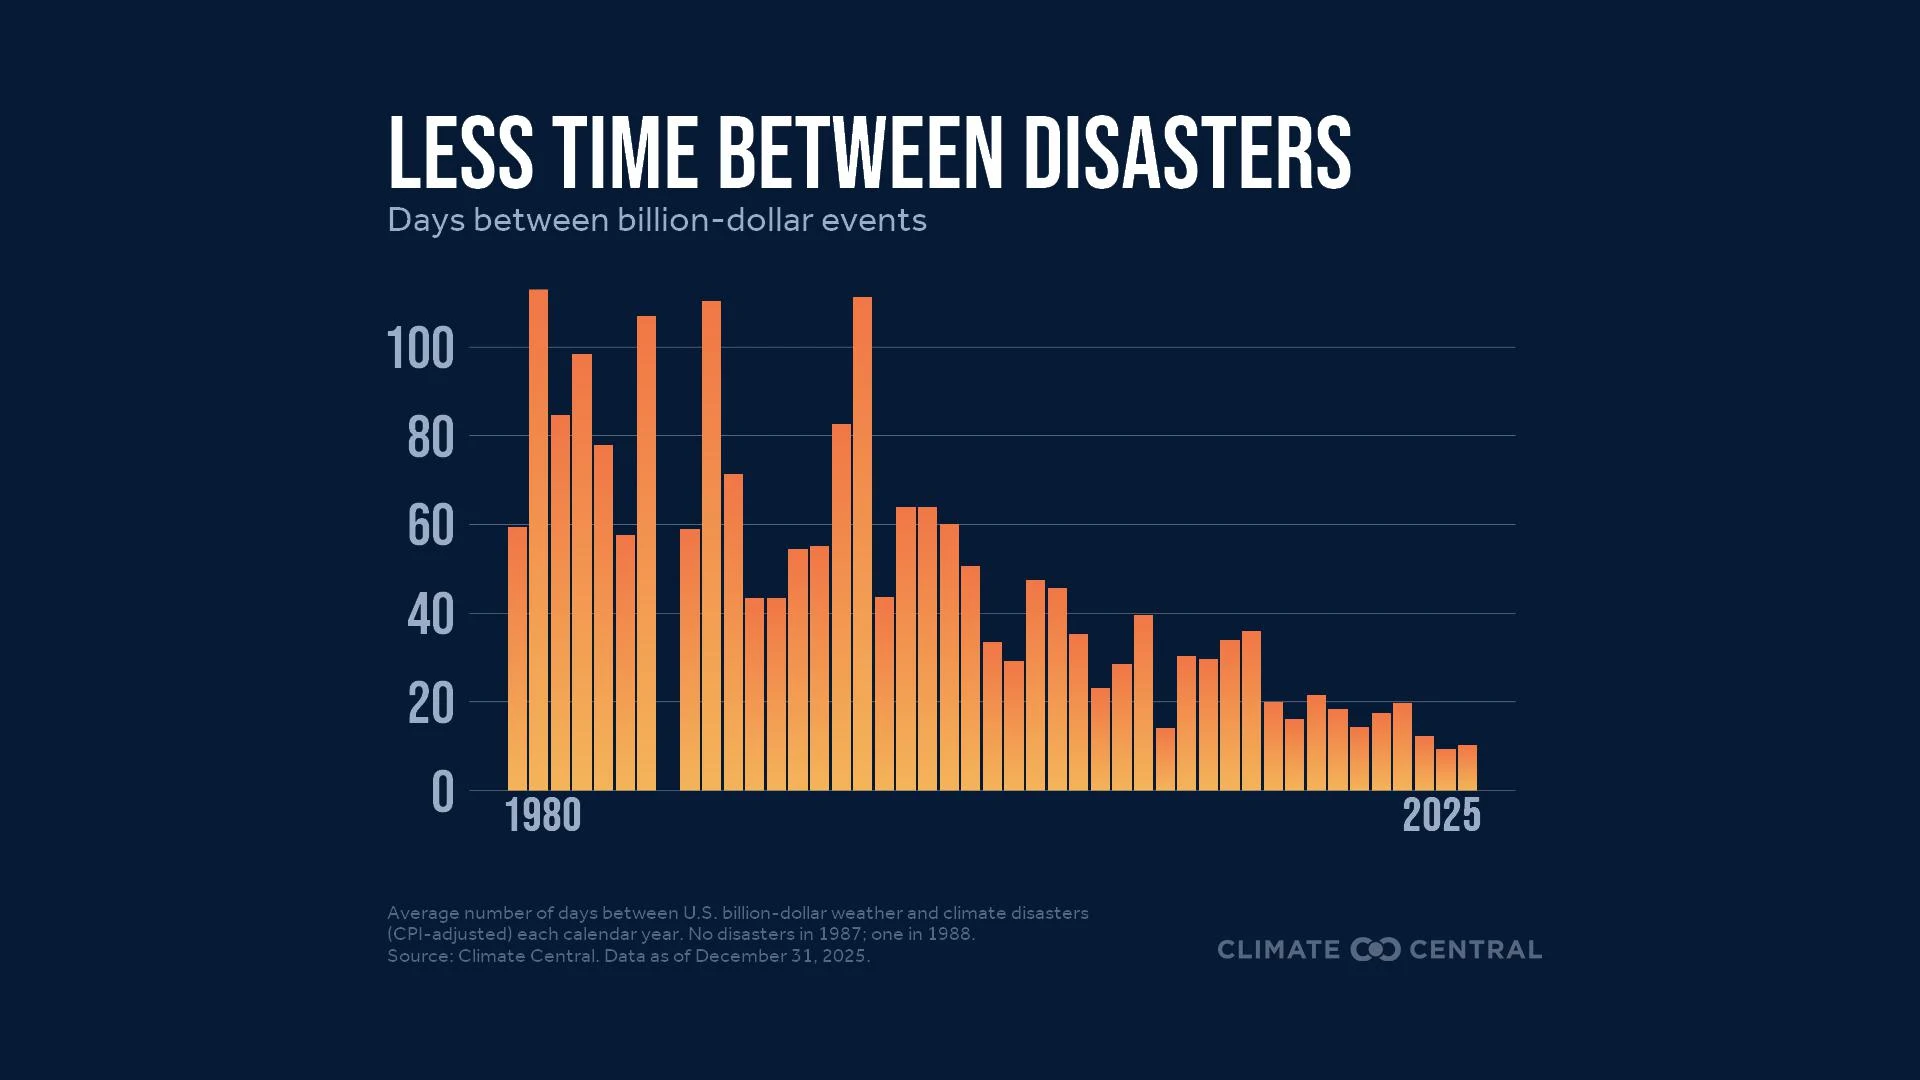
Climate Central reports 23 U.S. billion‑dollar weather and climate disasters in 2025 causing an estimated $115 billion in damages and 276 fatalities, placing 2025 third behind 2023 and 2024 for annual events. The costliest loss was the January Los Angeles wildfires at $61.2 billion (31 deaths, >16,000 structures lost), while severe storms set a new record with 21 billion‑dollar events; since 1980 the U.S. has endured 426 such disasters totaling >$3.1 trillion and ~17,194 lives lost. The analysis highlights a rising frequency and intensity of extreme events — including heat‑driven drought and compressed inter‑disaster intervals — with clear implications for insurers, infrastructure planning, supply chains, and fiscal exposure.
Market structure: The surge to 23 billion-dollar events in 2025 shifts economics toward risk-transfer and resiliency suppliers. Reinsurers and ILS managers (pricing power in Jan–Apr renewal cycles) are positioned to lift rates ~15–30% across exposed lines, while primary P&C carriers and regional muni issuers face immediate reserve hits and higher loss-adjustment expenses, compressing near-term ROE. Risk assessment: Tail risks include regulatory curbs on coastal development and class-action litigation that can force retroactive reserve strengthening (big hit scenario: 10–20% capital draw for exposed carriers). Near-term (days–weeks) volatility around quarterly earnings and state rate approvals; medium (3–12 months) show premium repricing; long-term (1–3 years) structural repricing and accelerated capex in grid/resilience drive commodity and construction cycles. Trade implications: Direct winners: reinsurers, ILS allocations, building-material retailers, copper/miners and grid/renewables equipment suppliers; losers: underpriced regional property insurers, long-duration munis in disaster-prone states, some homebuilders. Volatility catalysts: rate-filings (Mar–May 2026), reinsurer renewals, and FEMA/muni issuance schedules—trade with 3–12 month horizons and event-triggered stop-losses. Contrarian angles: The market may over-penalize primary insurers while underpricing reinsurer upside and ILS demand; historically (post-2005) disciplined reinsurers outperformed within 12–24 months as rates reset. Beware supply-chain lags: building-cost inflation can both boost retailer revenue (HD/LOW) and squeeze builder margins, producing asymmetric outcomes across the construction supply chain.
AI-powered research, real-time alerts, and portfolio analytics for institutional investors.
Request DemoOverall Sentiment
moderately negative
Sentiment Score
-0.55
