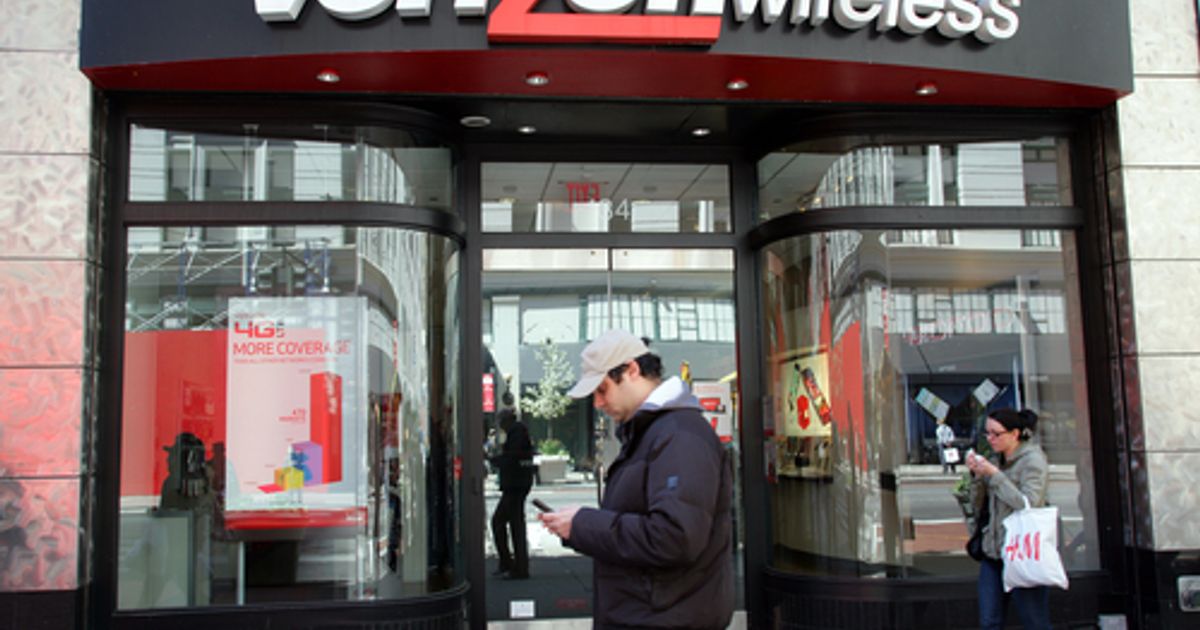
Verizon topped Q4 expectations with adjusted EPS of $1.09 versus consensus ~$1.06 and revenue of $36.4 billion (vs. ~$36.1B forecast), driven by 616,000 postpaid phone net additions and 372,000 broadband additions (319,000 fixed wireless access, 67,000 Fios). Full-year 2025 adjusted EPS was $4.71 (GAAP $4.06) on $138.2 billion revenue; management issued 2026 guidance reflecting the Frontier close (Jan 20) targeting 750,000–1 million retail postpaid phone net additions, 2%–3% mobility and broadband service revenue growth, adjusted EPS $4.90–$4.95, OCF $37.5–$38.0B, capex $16.0–$16.5B and at least $21.5B free cash flow — a bullish operational and financial outlook that should influence investor positioning in the stock.
Market structure: Verizon’s Q4 beat and Frontier close materially scale its fiber footprint (>30M homes) and strengthen broadband pricing power versus regional ISPs and some cable operators. Expect direct winners: Verizon (VZ shares, fiber-equipment suppliers) and enterprise customers gaining better service; losers: smaller DSL incumbents, low-end wireless MVNOs and satellite providers facing higher churn risk. The 616k postpaid adds and 372k broadband adds signal demand resiliency for connectivity even with modest wireless service revenue growth (+1.1%); pricing leverage is nascent, not immediate.
Risk assessment: Key tail risks are integration execution (service disruption, legacy copper remediation), higher-than-expected Frontier attrition, and leverage stress if synergies miss — watch Net Debt/EBITDA (trigger >3.5x). Time horizons: immediate (days) = positive sentiment/pop; short-term (weeks–months) = subscriber trends and integration KPIs will drive re-rating; long-term (3–36 months) = scale should improve margins and FCF (guidance FCF ≥$21.5bn, capex $16–16.5bn) if capex discipline holds. Hidden dependencies include wholesale contracts, local franchise costs, and migration of Frontier customers to VZ systems.
Trade implications: Tactical: bias long VZ equity (sizeable but controlled) to play 2026 guidance (750k–1M postpaid adds; EPS $4.90–4.95) while using options to cap downside. Relative value: favor VZ vs. AT&T (T) or large MSO cable names — Verizon’s newly scaled fiber gives it a pathway to higher ARPU and lower churn over 12–24 months. Cross-asset: expect limited credit stress unless synergies miss; a negative surprise could widen VZ credit spreads 20–50bp and lift short-dated vol.
Contrarian angles: Consensus celebrates scale but underweights integration costs and legacy Frontier churn; the market may be underpricing a 6–12 month operational drag. Conversely, guidance is conservative — if execution is clean, upside could be >15% within 12 months. Historical parallels: AT&T’s DirecTV and Time Warner integrations show size + complexity can destroy value; monitor 90-day integration KPIs closely for early signals of success or failure.
AI-powered research, real-time alerts, and portfolio analytics for institutional investors.
Request DemoOverall Sentiment
moderately positive
Sentiment Score
0.60
Ticker Sentiment
