
Selling a Home Now Costs More Than $80,000, Up 22% From 2025
Source: PR Newswire
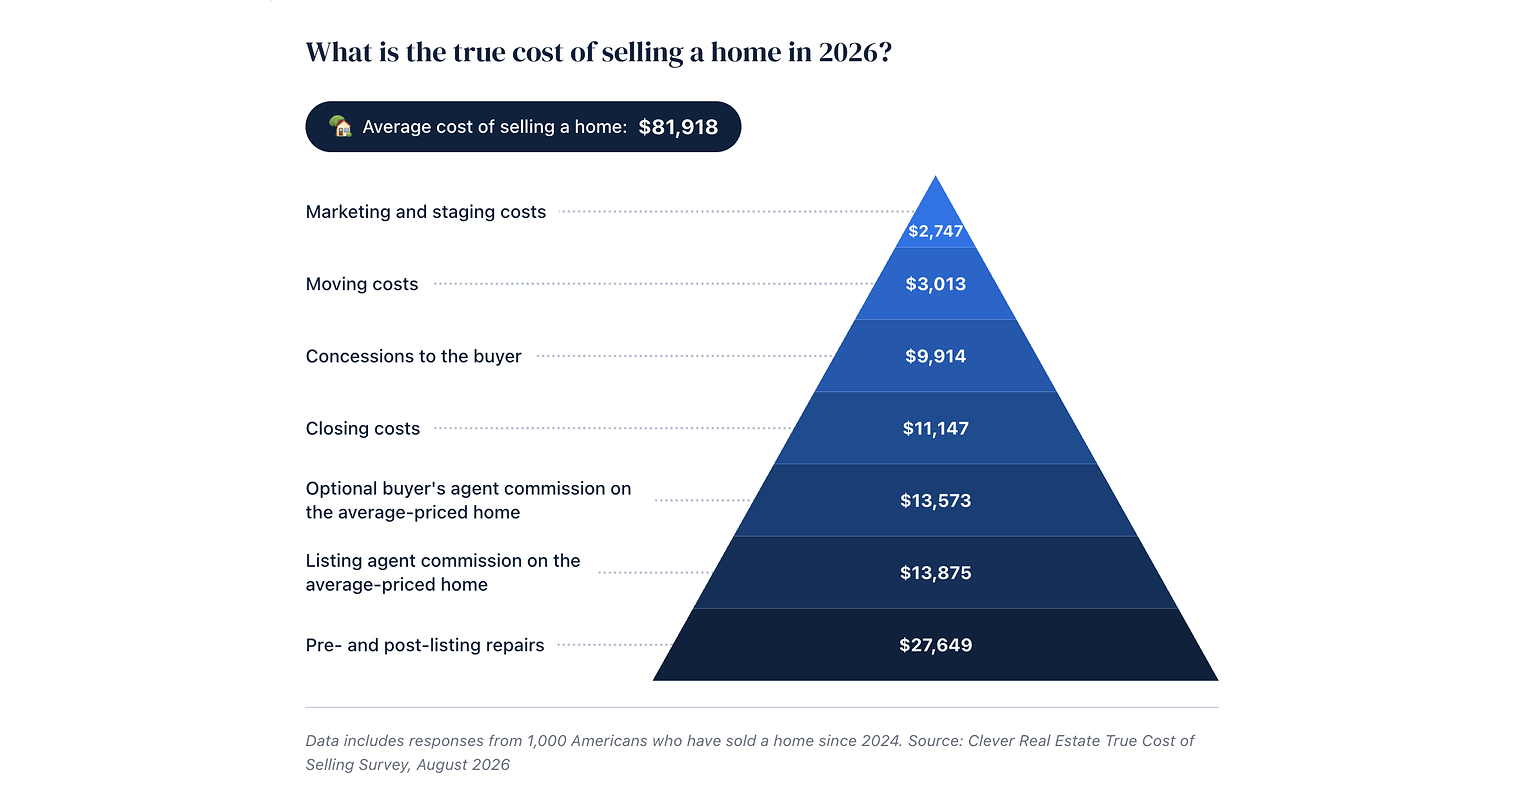
U.S. home sellers spent an average of $81,918 to sell in 2026, up 22% from $67,245 in 2025 and more than triple their $26,883 expectation. Repairs averaged $27,649 (+32%), while closing costs rose to $11,147 (+36%); 24% of sellers went into debt to cover selling costs. Although 80% made a profit averaging $191,304, 39% said it was lower than expected because of those costs.
Analysis
This is a weak, potentially biased survey signal—not evidence by itself of a deterioration in national housing fundamentals. Its more useful implication is higher transaction friction: sellers facing repair, concession, and closing-cost burdens may delay listing, accept lower net proceeds, or trade down less often. That can weigh on existing-home turnover and, with a lag, mortgage origination, title/settlement activity, moving services, and home-furnishings demand. Rates, affordability, and inventory remain the dominant drivers; do not infer a broad housing-demand break from this report.
At the margin, price-transparency and low-commission broker models could gain consideration, while traditional brokerage economics face pressure if sellers increasingly shop commissions. But the report is published by a discount broker, uses self-reported data, and does not establish that lower commissions improve outcomes across markets. The DIY comparison is not a clean causal test. Repair spending may support home-improvement demand, but the report does not show how much spending is incremental versus deferred maintenance or how it divides among public retailers and contractors.
Near term, likely limited market impact. Over 1–3 months, watch existing-home listings and sales, time-on-market, price reductions, and mortgage applications for confirmation of transaction friction. Over 6–18 months, persistently high seller costs could reinforce low turnover and favor lower-cost brokerage models. The thesis weakens if sales and listings rise without worsening time-on-market or concessions, or if transaction-cost measures normalize. No standalone directional housing trade is justified on this source alone.
AllMind Terminal
AI-powered research, real-time alerts, and portfolio analytics for institutional investors.
Request TrialMarket Sentiment
Overall Sentiment
mildly negative
Sentiment Score
-0.20
Key Decisions for Investors
- No trade on the report alone. Treat it as a hypothesis to test against NAR existing-home sales, listings, days on market, price cuts, and MBA purchase applications over the next 1–3 months.
- Keep a relative-value watch on traditional brokerages such as Compass and Anywhere Real Estate versus lower-cost brokerage models; only consider a short traditional-brokerage exposure if commission pressure appears in company disclosures and transaction volumes also weaken. The survey does not establish either condition.
- Monitor Home Depot and Lowe’s for repair-related demand, but do not extrapolate the survey into an earnings upgrade: verify comparable sales, project mix, and management commentary for evidence that sale-preparation work is incremental rather than timing-shifted.
More News
- Fed expected to hold rates steady, but Warsh may point way to more hikes
- Labubu-maker Pop Mart's shares extend declines as third-quarter sales plunge
- Airlines are trading nearly 23% higher ticket prices for emptier planes as jet fuel prices spike over 90% from the Iran War’s fuel squeeze
- The Trump admin said energy costs were a small price to pay in Iran war, but U.S. consumers are paying nearly 8x more than anyone else in fuel costs
- Early third-quarter earnings show a 'resilient' U.S. consumer, with signs of strain
- KO/PEP earnings spread: what changed and what didn’t after Coca-Cola’s beat