
Texas Instruments: The Strong Q3 Report Is Not A Reason Get Excited About The Stock
Source: seekingalpha.com
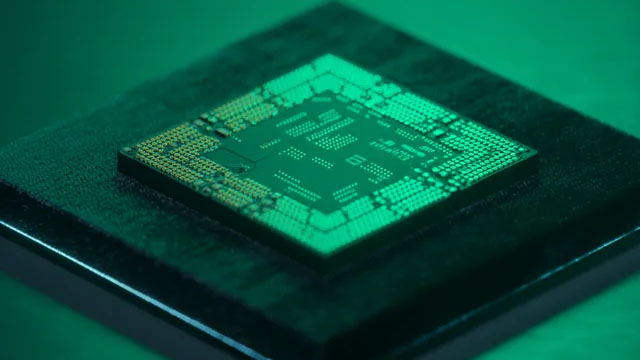
The article says Texas Instruments made significant progress in some areas in its Q3 results, even as its stock declined. It argues share-price performance may diverge from business results again around the next quarterly report, but provides no specific financial figures or magnitude for the stock move.
Analysis
The disconnect is potentially a expectations-and-cash-flow issue, not evidence by itself that reported operating progress is immaterial. In analog semiconductors, improving orders or utilization can precede a visible earnings recovery: pricing, product mix, inventory normalization, and fixed-cost absorption may lag. For TXN, investors may also weigh current cash generation against its long-dated manufacturing investment; higher depreciation and capital spending can keep free-cash-flow optics weak even if demand stabilizes. That creates scope for the stock to underperform near-term fundamentals, then rerate only when cash conversion and returns on capacity become credible.
The key 1–3 month test is whether subsequent guidance confirms sequential demand improvement and whether inventory, utilization, and cash-flow trends support it—not whether management can point to isolated areas of progress. A broad industrial-demand recovery would also benefit peers such as Analog Devices, NXP Semiconductors, and STMicroelectronics, limiting the durability of any TXN-specific rerating if relative results disappoint. Conversely, renewed customer destocking or weaker industrial orders could turn a valuation/expectations debate into an earnings estimate-cut cycle.
There is not enough information here to establish how much optimism is priced in or quantify downside. The contrarian risk is treating a falling share price as proof the market is irrational: it may be discounting delayed cash returns rather than disputing the operating data. Verify segment trends, order commentary, inventory, capex, depreciation, and free-cash-flow guidance before taking directional exposure.
AllMind Terminal
AI-powered research, real-time alerts, and portfolio analytics for institutional investors.
Request TrialMarket Sentiment
Overall Sentiment
neutral
Sentiment Score
0.00
Ticker Sentiment
Key Decisions for Investors
- No immediate directional trade from this information alone. Use the next report as a catalyst check; compare orders and sequential revenue trends with inventory and utilization rather than relying on qualitative progress.
- Keep TXN on a conditional long watch if demand improves across multiple end markets and free-cash-flow guidance stabilizes despite elevated investment. Falsify the thesis if guidance weakens, inventory rises relative to sales, or cash conversion deteriorates further.
- Avoid assuming TXN-specific strength from a sector recovery. Track relative revenue and guidance against Analog Devices, NXP Semiconductors, and STMicroelectronics; persistent underperformance would argue for company-specific execution or mix issues.
- Before sizing any position, verify the market's earnings and free-cash-flow expectations and the company's capex, depreciation, and inventory trajectory. Without those inputs, risk/reward and whether the share-price decline is overdone cannot be assessed.
More News
- Rosenblatt raises Texas Instruments stock price target on demand
- Texas Instruments lifts quarterly profit 78% as chip demand broadens
- Texas Instruments: 3 Key Takeaways for Long-Term Investors
- Stock Movers: P&G, Spotify, Lam Research (Podcast)
- ‘They are trying to intimidate us’: Indonesia’s Prabowo remains defiant in the face of an MSCI double downgrade
- US tech stocks tumble as investors fret over AI spending
From AllMind Research
- Anthropic IPO Preview: Valuation, Timing, and What to Watch
- Shein After the IPO: Venue, Valuation, and What Must Be Proved
- What AI Research Tools Should a Small Hedge Fund Buy First?
- How to Evaluate Consensus Estimates Platforms With AI
- Weekly Update: Adding Live MBO Level 3 Data - Liquidity Heatmap, OFI Charts, and More