
S&P 500 Ends Longest Streak of Calm Since 2020 as AI Trade Sinks
Source: Bloomberg
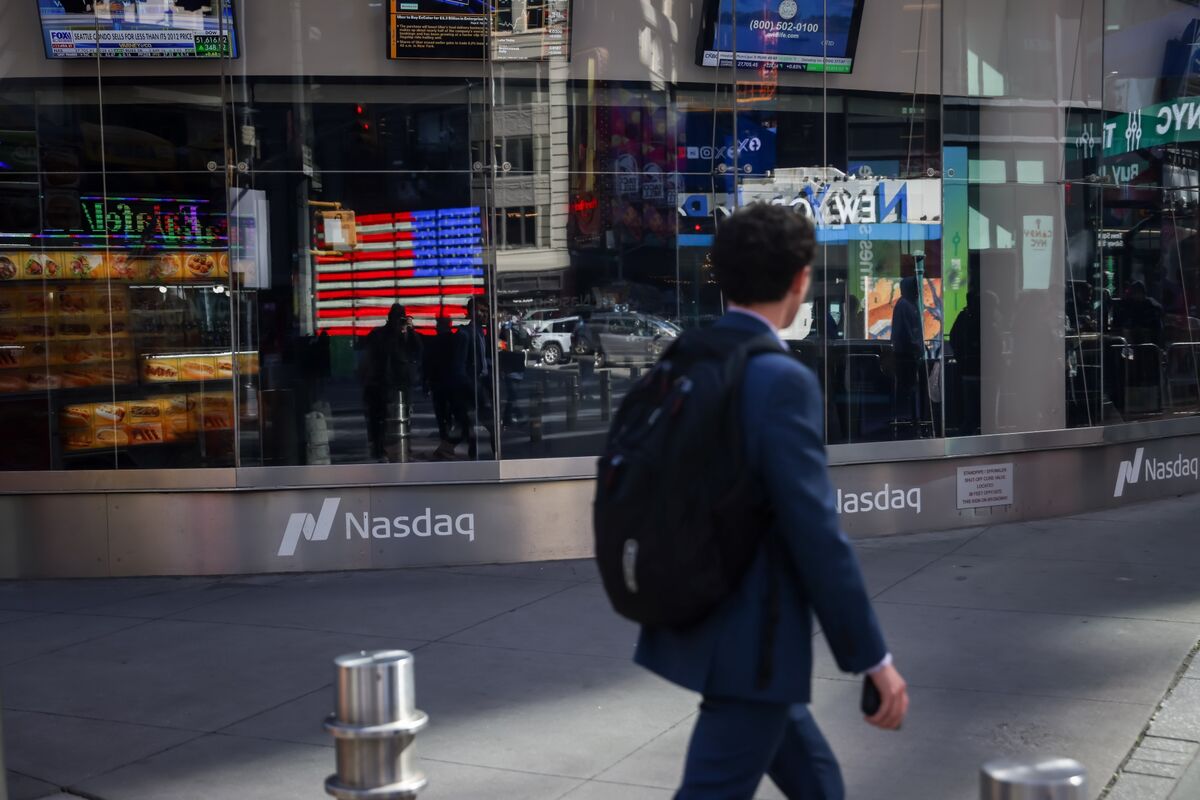
The S&P 500 fell 1.1%, ending its 53-session streak without a 1% decline—the index’s longest such stretch since January 2020. Concerns about the sustainability of the AI trade and a report showing the fastest consumer-price increase since April prompted the reversal. Computer-driven quant funds, which had been buying stocks during the volatility lull, were vexed by the shift.
Analysis
The important shift is from low realized volatility to a potential positioning unwind—not evidence by itself that the AI investment cycle has peaked. Systematic strategies that add exposure as volatility falls may now reduce risk, amplifying further declines if realized volatility and correlations rise. That creates near-term downside convexity in crowded, high-duration leaders even without a major earnings revision.
The inflation surprise is the more consequential 1–3 month catalyst: if subsequent data keep Treasury yields elevated, valuation pressure could broaden beyond AI and challenge the assumption that any dip in mega-cap growth is automatically buyable. Conversely, if inflation cools and yields stabilize, the broken streak may prove a technical reset rather than a regime change. Over 6–18 months, the differentiator remains whether AI-related spending converts into measurable customer returns; a sentiment reversal alone does not answer that question.
Contrarian view: one 1.1% decline after an unusually quiet period is not a durable volatility regime signal. Chasing downside volatility after the break risks paying up for protection just as systematic selling exhausts. Confirmation should come from persistent higher realized volatility, deteriorating market breadth, and rising yields—not the streak ending in isolation.
AllMind Terminal
AI-powered research, real-time alerts, and portfolio analytics for institutional investors.
Request TrialMarket Sentiment
Overall Sentiment
mildly negative
Sentiment Score
-0.30
Key Decisions for Investors
- Near term, avoid adding to crowded AI and long-duration growth exposure solely on a dip. Reassess sizing against a scenario of higher yields and systematic de-risking; use defined-risk QQQ put spreads only if implied volatility and skew leave acceptable carry and payoff.
- For the next 1–3 months, monitor Treasury yields, inflation releases, market breadth, and realized volatility. A sustained rise in yields alongside weaker breadth would support reducing Nasdaq-100 exposure versus the S&P 500; stabilization in yields and breadth would argue against extending that underweight.
- Do not treat the volatility break as a standalone short signal. A reversal in inflation data, contained realized volatility, or renewed breadth improvement would falsify the de-risking thesis and could make outright volatility longs costly.
- Over 6–18 months, distinguish AI sentiment from AI monetization: track company-level spending plans, customer returns, and guidance. If spending remains strong but returns disappoint, reassess exposure to the most valuation-sensitive parts of the theme; the article alone does not establish that condition.
More News
- Why is Samsung Electronics stock plunging today?
- SK Hynix plunges 8% amid Asia tech rout as Fed rate hike fears, AI funding worries mount
- SK Hynix seeks U.S. chip equipment exports to China tied to new factory
- Hot September CPI Spurs Fed Rate Hike Fears
- Dell stock plunges 11%, leading data center sell-off on concerns about 'enterprise AI timing'
- Why is Rocket Lab stock tumbling today?
From AllMind Research
- Anthropic IPO Preview: Valuation, Timing, and What to Watch
- Shein After the IPO: Venue, Valuation, and What Must Be Proved
- What AI Research Tools Should a Small Hedge Fund Buy First?
- Capital Intensity as Gravity: The AI Trade Enters Its Industrial Era (Looking at Q3 2025 Earnings in Tech)
- AI Portfolio Monitoring: Build an Alert Policy Analysts Can Audit