
Cracker Barrel Soars 90% in 6 Months: Buy or Sell the Stock?
Source: zacks.com
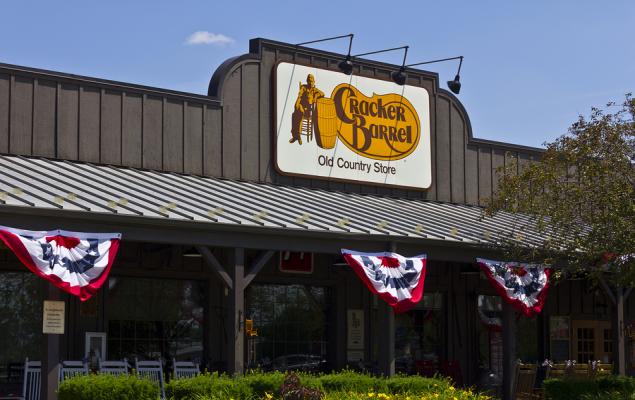
Cracker Barrel shares have risen about 90% in six months, versus a 16.6% decline for the restaurant industry, as traffic and guest metrics improve and the company advances its turnaround. Management expects fiscal 2027 adjusted EBITDA of $180 million-$200 million and comparable restaurant sales growth of approximately 3%-5%; debt fell $147.4 million year over year to $337.2 million, with $541.3 million in available liquidity. Analysts raised fiscal 2027 EPS estimates to $1.45 from $1.18, though lower-income consumer pressure and commodity and wage inflation remain risks after the sharp rally.
Analysis
The key underwriting question is whether better guest metrics convert into durable traffic and profitable check growth—not whether management can produce near-term cost leverage. Loyalty-driven visits may be bought with discounts, while retail attachment and dinner recovery require customers to spend beyond the core breakfast occasion. Watch transaction growth, average check, promotional intensity, and restaurant-level margin together; sales growth alone could mask deteriorating economics. Wage and food inflation also make “invisible” productivity savings harder to distinguish from temporary cost deferral.
The 6–18 month setup is asymmetric after the sharp rerating: execution could support earnings, but any traffic miss or margin shortfall may compress the turnaround premium quickly. The article’s valuation discussion is internally inconsistent: it calls the sales multiple a premium while reporting a figure below its stated industry comparison. In any case, sales multiples are a weak cross-company signal without comparable margins and debt treatment. Verify the peer set and valuation inputs before using them.
Near term, the catalyst is evidence that comparable traffic and EBITDA margins are tracking toward guidance. Over 1–3 months, revisions are less persuasive unless supported by reported operating data. The thesis weakens if traffic stalls, margin gains depend on cuts that degrade service, or commodity and labor costs outrun pricing/productivity. A deeper consumer pullback is a downside tail because value-oriented customers may reduce discretionary restaurant and retail spend together.
AllMind Terminal
AI-powered research, real-time alerts, and portfolio analytics for institutional investors.
Request TrialMarket Sentiment
Overall Sentiment
mildly positive
Sentiment Score
0.35
Key Decisions for Investors
- Do not chase the rally on estimate revisions alone. For existing exposure, consider trimming into strength unless reported transaction growth and restaurant-level margin improvement confirm the operating leverage.
- Set an earnings-event alert: reassess for a starter long only if comparable traffic improves without heavier discounting and margins progress toward management’s outlook. A traffic reversal or guidance reduction falsifies the recovery thesis.
- No immediate pair trade versus Darden Restaurants, Inc. (DRI) or BJ's Restaurants, Inc. (BJRI): the article provides no comparable margin, traffic, or valuation-method data. Revisit relative value after verifying those inputs and the inconsistent P/S comparison.
More News
- The world needs Ukraine’s grain. Its farmers are running out of reasons to plant
- SpaceX to buy key spectrum that could help Starlink Mobile become major US cell carrier
- Delta Cuts Profit Outlook as Surging Fuel Costs Tighten Grip
- Why is the Chinese stock market missing the AI rally
- OpenAI's revenue scare, Delta earnings, what investors think of a Starbucks-Chipotle deal and more in Morning Squawk
- Delta Air Lines cuts 2026 forecast on fuel surge, but CEO says demand is still strong
From AllMind Research
- Anthropic IPO Preview: Valuation, Timing, and What to Watch
- Shein After the IPO: Venue, Valuation, and What Must Be Proved
- What AI Research Tools Should a Small Hedge Fund Buy First?
- Run Cost-Controlled Financial Research in AllMind Agent Studio
- State of Public Markets, June 2026: Higher for Longer Meets the AI Supercycle