
State of Public Markets, June 2026: Higher for Longer Meets the AI Supercycle
AllMind's June 2026 state of the market across public equities, interest rates, fixed income, AI, venture capital, and the global economy, and why the Fed cuts we expected this year never came.

Published June 8, 2026

In this article
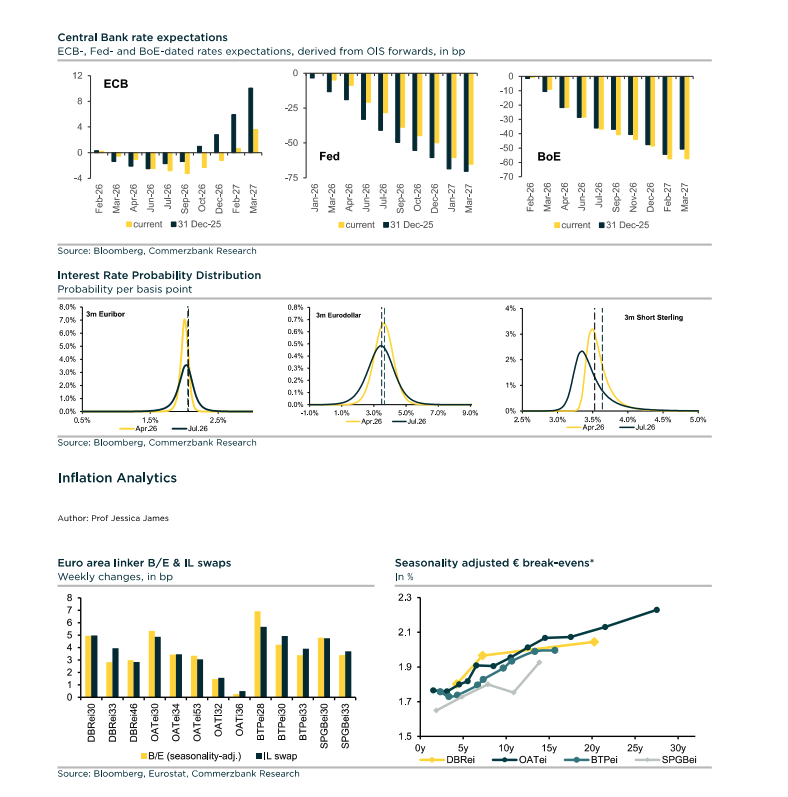
The market's January view of the 2026 rate path. Five months on, that path has inverted: the cuts never came, and by June the market was pricing a hike instead. Source: J.P. Morgan Asset Management.
Five months ago we opened the year with two convictions: the Fed would trim about 50 basis points into a soft landing, and a narrow, richly valued market would finally broaden as the megacaps mean-reverted. We got the destination roughly right and the road almost entirely wrong. The S&P 500 is sitting near the 7,500 we called for, but it climbed there on zero rate cuts, and the rates market is no longer debating cuts at all. It is pricing a hike.
June 5 made the case in one session. A 172,000 May payrolls print, nearly double the 88,000 consensus, was enough to erase a nine-week melt-up and hand the index its worst day since October, a 2.6% drop. Core PCE is still stuck at 3.3%. The October FOMC contract now carries roughly a 70% implied probability of a hike, with December near 73%. The cut we built into our January base case is gone, and in its place sits a market handicapping the opposite move.
One jobs report did what nine weeks of rally could not. It reminded the market that the cut was always an assumption, not a promise.
What makes mid-2026 strange is that the AI economy is behaving as if none of this is happening. Hyperscaler capital spending is tracking above $700 billion this year, already past the $4.7 trillion-through-2030 path we sketched in January, and the SpaceX and Anthropic listings are still penciled in for June and October. Two regimes are now running straight at each other: a higher-for-longer rate world, and an AI buildout financed on the assumption that money would get cheaper.
The hinge was geopolitical, not monetary. Iran's move to close Hormuz put a war premium back into Brent near $97 and reaccelerated inflation across every major economy, which is why a single stretch of June has the ECB (the 11th) and the Bank of Japan (the 16th) hiking while the Fed (the 17th) and the Bank of England (the 18th) hold. The rest of this guide is about who pays when a tightening rate regime finally collides with a leveraged, capex-heavy buildout that has no memory of expensive money.
Key Takeaways
- Our 7,500 was right; our cut call was wrong. The S&P sits near our January target but got there on zero cuts, with the CAPE near 39 and almost no equity risk premium. A single 172k jobs print on June 5 flipped pricing toward an October hike and erased a nine-week melt-up in one 2.6% session, the worst day since October.
- Mean reversion happened inside the Mag 7, not away from it. Alphabet (+160%) and Nvidia carry the index while Microsoft (-24% YTD) drags; at ~35% of cap and ~70% of economic profit the cohort still decides direction, and with 0DTE options near 59% of SPX volume, drawdowns turn reflexive fast.
- Developed-market policy is tilting back toward tightening. In eight days the ECB (June 11) and BoJ (June 16, to 1%) hike while the Fed (June 17) and BoE (June 18) hold, the first such tilt in three years, with markets pricing ~73% odds of a US hike by December and core PCE stuck at 3.3%.
- 'Supply for longer' aged well; credit is the new crowded trade. Roughly $18T of OECD issuance and a positive term premium pushed the 30-year above 5%, while IG at 77bp and HY at 272bp pay 2 to 2.5% for losses running 4 to 4.5%, with private-credit defaults at a record 6% and BDCs (Blackstone, Blue Owl) gating redemptions.
- We underpriced the AI buildout, and now it is rate-sensitive. 2026 hyperscaler capex above $700B (Goldman models $7.6T through 2031) tops our $4.7T-through-2030 call, but it runs at 90 to 100% of operating cash flow and is increasingly bond- and lease-funded, into a Fed that may hike rather than cut.
- AI revenue is finally real; the multiple is the open question. Anthropic projects a first profitable quarter on a ~$47B run-rate and OpenAI is near $25B, yet capex still outweighs revenue by roughly 10 to 1, and the Anthropic and OpenAI listings are the first public referendum on whether those economics hold.
- Q1's $330.9B venture record is an optical illusion. Five AI names absorbed about $196B; strip them and the total drops nearly 60% on the lowest deal count since 2016, while private equity sits on a record $3.8T of unsold assets with DPI at just 14% of NAV and fundraising at 2017 lows.
- The year's pivot was geopolitical, not monetary. Iran's Hormuz closure reaccelerated inflation everywhere and flipped the Fed, ECB and BoJ from easing to tightening; US growth is boxed in near 1.6%, while Asia's chip supercycle (Korea exports +53%, KOSPI +100% YTD) and India at 7.7% are the bright spots.
- Own the scarcity, respect the Fed. Copper near our $13,500 call, Brent near $97 and PJM power up 76% YoY are bid on physical shortage, while a firm dollar (DXY ~99-100) and the no-cut repricing round-tripped gold and silver and knocked Bitcoin more than 50% off its October high on $4.4B of ETF outflows.
Contents
| Section | Coverage |
|---|---|
| I. Executive Summary | The higher-for-longer-meets-AI-supercycle thesis |
| II. Public Equities | S&P 500, the Magnificent Seven fracture, sell-side targets, Europe, Asia, EM |
| III. Interest Rates & Central Banks | The Fed's lost easing path, the bond market in charge, ECB / BoJ / BoE |
| IV. Fixed Income & Credit | IG and high yield, sovereign supply, private-credit stress, securitized |
| V. Artificial Intelligence | Hyperscaler capex, chips and the power ceiling, revenue, the IPO test |
| VI. Venture Capital & Private Markets | The concentrated record quarter, the exit window, buyouts |
| VII. Global Economies & Geopolitics | US, China, Asia, Europe, and the Iran shock that reset the year |
| VIII. Commodities, FX & Digital Assets | Gold's round-trip, the oil and power bill, the dollar, crypto |
| IX. What We Are Watching | The June and October binary events that settle the year |
Bottom Line Up Front
| Theme | Signal | View |
|---|---|---|
| US AI megacaps | Crowded | The Magnificent Seven are ~35% of S&P 500 value and ~70% of its economic profit, and they have split: Alphabet (+160%) and Nvidia carry the index while Microsoft (-24% YTD) drags. With 0DTE options near 59% of SPX volume, selloffs turn reflexive. |
| Ex-US equities | Two-speed | Europe (+7.4% YTD in EUR) and Japan (Nikkei +33%) beat the US, and Korea's chip supercycle drove KOSPI +100% YTD; India compounds at 7.7% but is bleeding record foreign outflows on a stagflationary RBI. A re-strengthening dollar is the swing factor. |
| Fed funds path | Higher for longer | Hold expected June 17, but core PCE at 3.3% and a 172k May payroll beat put a 2026 hike in play; markets price ~73% odds of a hike by December. Our January 50bp-cut call is the casualty. |
| DM central banks, mid-June | Tightening tilt | The ECB (June 11) and BoJ (June 16, to 1%) hike while the Fed (June 17) and BoE (June 18) hold, the first developed-market tilt back toward tightening in three years. The BoJ move plus Treasury repatriation is the most underpriced global risk. |
| Treasury long end / duration | Avoid duration | Bear steepening intact: near $10T of gross US issuance and a 73-83bp term premium hold the 30-year above 5%, last seen in 2007. A yen carry unwind could add 20-50bp to the 10-year and turn disorderly. |
| IG & HY credit | Crowded | Tightest spreads since 2007 (IG 77bp, HY 272bp) pay 2-2.5% for losses running 4-4.5%. High all-in yields, almost no cushion if risk sentiment turns. |
| Private credit & leveraged loans | Risk-off | A record 6% private-credit default rate, BDC redemption gates (Blackstone, Blue Owl), and FSB and Fed scrutiny. Public spreads are not yet reflecting the private and middle-market stress. |
| Hyperscaler AI capex | Higher for longer | ~$745-775B in 2026, above our $4.7T-through-2030 path and Goldman's $7.6T-through-2031 model, but now 90-100% of operating cash flow and increasingly bond- and lease-funded, so highly rate-sensitive. |
| AI equities & chips | Bubble watch | Real, fast-growing revenue (Anthropic ~$47B run-rate and a first profitable quarter projected, OpenAI ~$25B) but ~10:1 spend-to-revenue and circular financing. Own cash-generative compute (Nvidia, Broadcom); short-leash the leveraged infra names. |
| Mega IPOs (SpaceX, Anthropic, OpenAI) | Binary | SpaceX prices June 11 and Anthropic targets October; near-trillion-dollar listings into a tape pricing a Fed hike are the first real public vote on AI economics. Treat as binary. |
| VC & private equity | Crowded / illiquid | Q1's $330.9B record shrinks ~60% once you strip the five biggest AI rounds (~$196B), on the lowest deal count since 2016. PE holds a record $3.8T of unsold assets, DPI at 14% of NAV, fundraising at 2017 lows. |
| Commodities, FX & crypto | Fed-gated, supply-bid | Physical scarcity keeps copper near our $13,500 call, Hormuz-bid Brent near $97, and PJM power +76% YoY; the no-cut repricing round-tripped gold and silver (J.P. Morgan still sees ~$6,000 gold if the Fed holds), firmed DXY to 99-100, and cut Bitcoin 50%+ from its October high. |
I. Executive Summary
Our January outlook rested on a single idea: a Fed easing into a soft landing would let a narrow, richly valued market broaden out. Half of it held. The S&P 500 sits near our 7,500 target, and the "supply for longer" bond thesis played out at roughly $18 trillion of OECD sovereign issuance, with the US 30-year yield breaking above 5% for the first time since 2007. The other half broke. There were no cuts. After June 5, the market prices a 2026 hike at about 73% odds. Mean reversion did arrive, just not where we were looking for it. It came inside the Magnificent Seven rather than away from it: Alphabet (up about 160%) and Nvidia now carry the tape while Microsoft (down 24% year to date) drags it, and at roughly 35% of S&P market value and 70% of its economic profit, the cohort still sets the index's direction.
That higher-for-longer regime is now the single variable pricing almost everything else. It is why credit is the crowded trade of mid-2026: investment grade at 77bp and high yield at 272bp pay almost nothing for risk just as private-credit defaults hit a record 6% and BDCs gate redemptions. It is why the commodity tape round-tripped gold, silver and Bitcoin (down more than 50% from its October high) on hike fears, while genuine scarcity held copper near our $13,500 call and kept Hormuz-bid Brent near $97. And it is the live threat to the AI supercycle, where 2026 hyperscaler capex above $700 billion now runs at 90 to 100% of operating cash flow, increasingly funded by debt and leases, against revenue (Anthropic at a roughly $47 billion run-rate, OpenAI near $25 billion) that the spend still outweighs by about ten to one.
Rates and AI collide in the primary market. Venture funding set a $330.9 billion record in Q1, but strip out the five largest AI rounds, about $196 billion, and the total falls nearly 60% on the lowest deal count since 2016. The exit window is cracking open on SpaceX (June 11) and Anthropic (October). Those near-trillion-dollar listings are the first real public vote on whether AI economics clear, and they arrive into a tape that is suddenly handicapping tighter policy, not looser. That leaves the playbook for the back half of 2026 narrower than the one we wrote in January: own the scarcity that trades on physical shortage, respect the rate sensitivity in everything else, and treat the marquee AI IPOs as binary events, not foregone conclusions. We opened the year expecting the market to broaden. It now has to prove it can stand on its own, without cheaper money or the benefit of the doubt on AI.
II. Public Equities
We made three calls in January. By June, the scorecard reads as a split decision. We said the Fed would ease by about 50 basis points, the S&P 500 would reach 7,500, and the megacaps would finally cede their leadership. The index hit its number and kept going. The Fed has gone the other way. And leadership did break, only it broke inside the Magnificent Seven rather than away from it. How all three played out over the same six months is the story of the US tape this year.
The US tape broke on a single jobs print
For most of 2026 the melt-up did exactly what the bulls asked of it. The S&P 500 rose for nine straight weeks and closed above 7,600 for the first time on June 2, at 7,609.78. Three days later, one payrolls print ended the party in a single session. The index closed at 7,383.74, the Nasdaq shed 4.18%, and the VIX leapt roughly 40% to 21.51. Lazard's Ronald Temple did not soften it: "any hopes of a Fed rate cut have effectively been eliminated."
| Index | Level (Jun 5, 2026) | Note |
|---|---|---|
| S&P 500 | 7,383.74 (-2.64%) | Worst day since Oct 2025; first close above 7,600 on Jun 2 |
| Nasdaq Composite | 25,709.43 (-4.18%) | Worst day since Apr 2025 |
| Stoxx 600 | ~623 (-0.3%) | +7.4% YTD in EUR, total return |
| DAX | ~24,848 | Off its ~25,500 cycle peak |
| Nikkei 225 | ~67,470 | Record 68,402 on Jun 3; about +33% YTD |
| KOSPI | ~8,160 (-5.5%) | Roughly doubled YTD |
What powered the run was real. Q1 2026 delivered blended S&P 500 earnings-per-share growth of 27.7%, the strongest since late 2021, on an 84% beat rate. The danger in the drawdown is the price the market paid for that growth. The forward multiple sits near 22 to 23 times, the Shiller CAPE is close to 39, and the plumbing underneath is brittle. The Magnificent Seven are about 34.8% of S&P 500 market cap and roughly 70% of its economic profit, and same-day-expiry options now run near 59% of SPX volume. A concentrated, passively owned index colliding with reflexive options flow is how an orderly repricing turns disorderly. Michael Burry spent May likening the tape to 1999 and buying puts on the chip ETFs, Nvidia and Oracle. Jeremy Grantham's GMO letter branded US equities a formal superbubble. Neither has been right on timing. June 5 gave both a hearing.
The Magnificent Seven stopped moving together
This is where our mean-reversion call half landed. The cohort did not deflate. It fractured. Alphabet is up roughly 160% over the trailing year and added 1.27 points to the index's gain by itself, carried by Google Cloud, where revenue grew 63% to $20 billion in Q1. Nvidia remains the center of gravity, with Q1 FY2027 revenue of $81.6 billion, up 85%, and Jensen Huang calling Blackwell demand "off the charts." Even so, it fell about 6% on June 5 and slipped back below a $5 trillion market cap. The other side of the cohort is uglier. Microsoft is down about 24% on the year, the single biggest drag on the index, its $190 billion capex bill outrunning Azure's 39% growth. The detonator on June 4 was Broadcom, whose record AI revenue could not offset a Q3 outlook of $16 billion against a $17.2 billion estimate. Behind all of it sits the capex question we take up in full later. The spending now runs through a tight circle of Nvidia, CoreWeave and hyperscaler financing, so any wobble in demand turns quickly into stranded-asset risk.
Wall Street chased the tape, then got caught
The sell-side spent the spring lifting targets into the earnings beat, which left almost everyone bullish in the exact week the tape broke. Citi raised its target to 8,100 on June 6, the day after the rout.
| Firm (strategist) | Year-end 2026 S&P 500 | 2026 EPS |
|---|---|---|
| Yardeni Research | 8,250 | n/a |
| Citi (Chronert) | 8,100 | $350 |
| Goldman Sachs (Snider) | 8,000 | $340 |
| Deutsche Bank (Chadha) | 8,000 | $320 |
| UBS | 7,900 | $335 |
| RBC | 7,900 | n/a |
| Morgan Stanley (Wilson) | 7,800 | n/a |
| JPMorgan (Lakos-Bujas) | 7,600 | $330 |
| BofA (Subramanian) | 7,100 | n/a |
The spread from BofA's Street-low 7,100 to Yardeni's 8,250 runs to more than 1,000 points, and the speed of revision is its own warning. JPMorgan and UBS each cut roughly 400 points on the March oil shock, then put it all back by May. Subramanian's "sell in June" now looks better timed than most. Goldman's 8,000 and Citi's 8,100 rest on the same premise, stable-to-easing policy, that June 5 threw into doubt. (Deutsche Bank and Morgan Stanley have not formally revised since late 2025.)
Europe held, Asia went vertical, India bled
The non-US story is genuinely better in places. In euro terms, European equities beat the US in the first half. The Stoxx 600 is up about 7.4% year to date, driven less by defense (the aerospace and defense sub-index is actually down on the year) than by banks, industrials and Germany's EUR 500 billion off-budget fiscal package. Goldman lifted its 12-month Stoxx 600 target to 660 while keeping Europe underweight, a fair read on a market that is cheaper (17 to 18 times forward versus 22 for the S&P) but slower growing.
Asia is where the AI trade went parabolic. Japan's Nikkei 225 hit an all-time high of 68,402 on June 3, about 33% higher on the year, as SoftBank passed Toyota to become the country's most valuable company, the listed proxy for OpenAI and Arm. The catch is a yen near 160 and a 74% implied probability of a BoJ hike to 1.0% on June 16, which revives carry-unwind risk. Korea's KOSPI roughly doubled before falling more than 5% on June 5, and Samsung and SK Hynix alone make up 42% of it.
Emerging markets are running at two speeds. The MSCI EM index is up about 7%, but that average buries the divide. China's onshore market is on an AI tear, the Shanghai Composite at its highest since 2015 and an Nvidia optical supplier, Zhongji Innolight, now the top weight in the CSI 300. India is the mirror image. Foreign investors have pulled a record 33 to 34 billion dollars, and the Nifty 50 is down 5 to 6% after the RBI held at 5.25% on June 5, trimming its growth forecast while lifting its inflation outlook. The hinge for all of it is the dollar. A year built on Fed easing now faces a Fed that may hike, and that one repricing is the through-line from New York to Mumbai.
III. Interest Rates & Central Banks
Mid-June is the hinge. Between June 11 and June 18, four major central banks meet, and for the first time in three years the developed-world policy bias is tilting up, not down. The Fed has not cut once this year, and as of June 6 the futures market puts a 72.7% probability on at least one hike by December, up from 50.5% the day before. We came into January expecting cuts and warning that bond supply would run heavy for longer. We were half right. The cuts never arrived; the supply did, and it has bitten harder than we expected.
| Central bank | Policy rate, early June | June meeting | Consensus action |
|---|---|---|---|
| Federal Reserve | 3.50%-3.75% | June 17 | Hold, with hike risk building into H2 |
| ECB (deposit rate) | 2.00% | June 11 | +25bp to 2.25% |
| Bank of England | 3.75% | June 18 | Hold |
| Bank of Japan | 0.75% | June 16 | +25bp to 1.00% |
A new chair inherits an inflation problem
The easing story did not fade. It broke. Headline CPI ran 3.8% in April, the hottest reading since May 2023, and core PCE, the gauge the Fed actually targets, sat at 3.3%, a level last seen in late 2023. Then May's payrolls came in hot and the labor market called the bluff, with wages still climbing 3.4% and real pay going backwards.
Two forces sit under the stickiness. The first is energy. The Strait of Hormuz disruption pushed it back through the inflation basket. The second is tariffs, and markets have underpriced them. Dallas Fed research shows the effective tariff rate reached 9.4% by the end of 2025, with the pass-through to consumer prices now essentially complete, lifting core goods PCE by roughly 0.8 points. Strip that out and core would be running near 2.5%. This is a supply shock, and rate hikes cannot fix it without crushing demand.
The funds rate has held at 3.50% to 3.75% since the April 28 to 29 meeting, where the FOMC split 8 to 4, its most fractured vote since October 1992. Three hawks wanted the easing bias gone; one dove wanted an immediate cut. That was Jerome Powell's last meeting in the chair. Kevin Warsh, confirmed 54 to 45 in the closest vote of the modern era, was sworn in on May 22 and chairs his first meeting on June 17. He has no use for forward guidance. "I don't believe that I should be previewing for you what a future decision might be," he told the Senate, which puts the dot plot itself in question. The base case for June 17 is still a hold, partly because Powell keeps a Board seat as governor through 2028 and a hawkish pivot needs a majority of the governors behind it. But the bias has flipped, and the next move is now as likely up as down.
Politics makes the job harder. At Warsh's swearing-in, Trump said he wanted the chair "totally independent," then spent the same afternoon promising to "get interest rates down quickly." Trump v. Cook, the effort to remove Governor Lisa Cook, remains unresolved at the Supreme Court, where even Justice Kavanaugh warned that the administration's position "would weaken, if not shatter, the independence of the Federal Reserve." With the deficit near $1.9 trillion and debt around 120% of GDP, fiscal dominance has stopped being a fringe worry.
The bond market is in charge
This is where the supply call landed. The Treasury has to roll roughly $7.5 trillion of maturities and fund a deficit near $2 trillion, close to $10 trillion of gross issuance inside twelve months, and the long end is buckling under the weight. On May 14 it sold 30-year paper at 5.046%, the first auction to clear above 5% since 2007. By late May the 30-year touched roughly 5.2%, a 19-year high. After the payrolls print the 2-year jumped to 4.162% and the 10-year to 4.544%. The 2s10s curve has steepened back to about +38 basis points, positive again after its long inversion. But this is bear steepening, driven by term premium rather than growth optimism: the New York Fed's model puts the 10-year term premium near 73 to 83 basis points. QT formally ended in December with the balance sheet around $6.5 trillion, so the Fed is no longer adding to the supply. It is not absorbing it either.
"Long-end rates are now in control of monetary policy."
That is Peter Boockvar's read, and it is the right one. The deficit feeds the issuance, the issuance feeds the term premium, and at 5% the long bond makes every future deficit more expensive to finance.
Abroad, the bias turns up
The pressure is not America's alone. The ECB held at 2.00% on April 30, but eurozone inflation has since jumped to 3.2% in May, core to 2.5%, energy up 10.9%, and a 25 basis point hike to 2.25% on June 11 is all but fully priced. It would be the first ECB hike in more than two and a half years. The Bank of England is the dove of the group. UK CPI fell to 2.8% in April, and Governor Bailey has said he is willing to tolerate above-target inflation to support a weak economy, so June 18 should bring a hold at 3.75%, with a one-and-done hike before year-end the live risk.
Japan is the one to watch. The BoJ is expected to take its policy rate to 1.00% on June 16, having lifted its core inflation forecast to 2.8%. The 10-year JGB sits near 2.66%, and the 40-year briefly broke above 4% in January, the first time since the bond was launched in 2007. With the yen pinned near 160 to the dollar, Japanese investors, the largest foreign holders of Treasuries at roughly $1.2 trillion, sold a net $29.6 billion in the first quarter, their biggest quarterly cut since 2022. TD Economics estimates that sustained repatriation could add 20 to 50 basis points to the US 10-year. The carry trade that bankrolled a decade of global risk-taking is unwinding slowly for now. A hawkish BoJ against a stumbling Fed is exactly the setup that turns slow into disorderly.
Our posture into the back half of the year is easy to state and uncomfortable to hold. Higher for longer is now the floor, not the ceiling. We expect a hold on June 17, but a 2026 hike is no longer a tail risk in our books. We stay cautious on the long end, where supply and term premium both point higher. And we keep circling June 16, because a Bank of Japan hike into a wobbling Fed is the most underpriced risk on the global calendar.
IV. Fixed Income & Credit
Bond investors spent the first half of 2026 waiting for a rally the calendar kept promising and the data kept refusing to deliver. Our January "supply for longer" warning has aged well. The cut we paired it with has not, and on June 5 the rates market stopped pretending otherwise.
That day, swaps gave up on the cut and began pricing its opposite. By the close, traders put roughly 73% odds on at least one increase by December, with the October meeting carrying most of that weight. The 10-year Treasury sat at 4.55%, the 30-year above 5%, and the Bloomberg US Aggregate clung to a 0.38% return on the year. Our cut thesis is gone. The supply thesis has played out exactly as advertised.
Corporate credit: paid well to own a thin cushion
The defining paradox of mid-2026 credit is uncomfortable to hold: all-in yields are the most attractive in two decades, and spread compensation is among the stingiest on record. Investment-grade option-adjusted spreads sat at 77 basis points on May 12, against a 10-year average near 130. They had touched 71 in January, the 2nd percentile of a 20-year range, widened to 89 by the end of the first quarter as tariff and geopolitical noise intruded, then compressed again. The all-in IG yield, near 5.2%, sits in the 72nd percentile of that same history. So the buyer collects a genuinely high total yield for accepting a genuinely poor spread. High yield tells the same story with sharper edges. The ICE BofA index closed at 272 basis points on June 1, near the tightest since 2007.
March showed how quickly that cushion can vanish. The US-Iran shock blew high-yield spreads 56 basis points wider in eight trading days, from roughly 305 to 361, and pushed CCC paper above 10.20% before the move reversed. Supply, meanwhile, has been voracious. Gross investment-grade issuance reached $721 billion in the first quarter, up 12% year on year and the largest quarter since 2020, much of it AI and data-center capex plus M&A paper. Order books ran four to five times oversubscribed and concessions compressed to 3 to 7 basis points, so demand swallowed the wave without complaint. The discomfort is structural, not technical. Spreads pay for about 2 to 2.5% of annual high-yield loss; Moody's trailing default rate has already drifted toward 4.2 to 4.5%.
"Investors aren't well compensated to own corporate securities right now." Stacie Ware, Fidelity Total Bond Fund.
Sovereign bonds: supply for longer, and a term premium that is finally real
This is where the January call landed. Term-premium models have swung positive for the first time since 2023, meaning lenders are once again paid extra to hold duration rather than penalized for it. Quantitative tightening formally ended in December 2025 with only half the pandemic balance sheet unwound, and the OECD now projects roughly $18 trillion of gross sovereign borrowing across its members in 2026, with refinancing alone accounting for close to 80% of issuance.
The long end is where the strain shows, and the table below lays it out. UK gilts are the sharpest case. The 30-year reached a 28-year high while the Debt Management Office set a record £273.4 billion gross financing requirement and deliberately tilted issuance toward shorter maturities to limit rollover risk. German Bunds broke through 3% to 3.04% on the March debt-brake reform and more than a trillion euros of defense and infrastructure spending, with the ECB now nearly fully priced to hike on June 11. French OATs, weighed down by a 4.7 to 5.0% deficit and the instability that followed Barnier, now trade close to the periphery they once sat comfortably above.
| Instrument | Level (early June 2026) | Context |
|---|---|---|
| IG corporate OAS | 77 bps | vs ~130 bp 10-yr average |
| HY corporate OAS | 272 bps | near tightest since 2007 |
| US 10-yr Treasury | 4.55% | term premium positive |
| UK 30-yr gilt | ~5.55% | 28-year high |
| German 10-yr Bund | 3.04% | debt-brake reform |
| Japan 10-yr JGB | ~2.66% | ~80% odds of June 16 BOJ hike |
| Lev loan distress ratio | 7.23% | from 4.34% in December |
| Private credit default | 6.0% | record; ~2-2.5% norm |
Private credit and the stress that does not show up in spreads
Public high yield looks calm. Private credit does not. Fitch clocked the private-credit default rate at a record 6.0% for the year ended April, triple its historical mean, and Morgan Stanley has warned direct-lending defaults could reach 8%. Payment-in-kind income, a proxy for distress that has not yet surfaced, reached 6.4% of loans by late 2025, nearly triple its 2021 level. New direct-lending issuance fell 40% to $44.76 billion in the three months to May.
Redemptions are the acute symptom. Blackstone's BCRED faced $3.8 billion of requests in March, 7.9% of assets, and injected $400 million of firm capital to avoid gating; Blue Owl's OCIC saw 21.9% of NAV requested in the first quarter. Regulators have arrived in force. The FSB published its first vulnerability report dedicated to the sector on May 6, and the Fed opened an inquiry into bank exposures in April.
The leveraged-loan and commercial real estate channels corroborate the drift. The loan distress ratio jumped to 7.23% by the end of March from 4.34% in December, and office CMBS delinquency hit a record 12.34% in January, above the 2008 peak, before easing to 11.20%. First Brands and Tricolor were fraud-driven and idiosyncratic, but they ended the zero-loss story for good.
Securitized: a split screen
Agency MBS offer the cleanest risk-reward in the complex. Current-coupon spreads sit near 151 basis points over swaps, a level AGNC's Peter Federico calls attractive for the long term, though negative convexity makes any backup in rates painful and the Fed is no longer there to buy. CLOs have repriced hard. AAA tranches widened about 10 basis points, but BB tranches blew out 150 to 200 wider, to 600 to 900 over SOFR, and the share of collateral marked below 90 cents climbed from 8.6% to 13.5%.
The genuinely new risk is AI data-center ABS. JPMorgan sees $30 to 40 billion of issuance in 2026, and CoreWeave's $8.5 billion, A3-rated, GPU-backed loan set the template, though a seven-year GPU life against a 20-to-30-year facility life builds a refinancing treadmill into the paper.
Municipals are the bright spot. The Bloomberg index is up 1.34% on the year, and long BAA names yield close to 8.90% on a tax-equivalent basis. The summer reinvestment technical supports them now, though a bear-steepening on a Fed hike would revive the 2022 outflow risk fast.
The asymmetry that runs through the whole asset class is the one we flagged in January, only sharper. Investors are being paid less to take credit risk than at almost any point this century, and the Fed has just traded a year of expected cuts for a live debate about hikes.
V. Artificial Intelligence
Our January outlook put cumulative AI capital spending at roughly $4.7 trillion through 2030. Five months on, that number looks low. Goldman Sachs now models $7.6 trillion through 2031, with annual outlays doubling from about $765 billion this year toward $1.6 trillion. The awkward part is the backdrop it now runs into. The June 5 selloff fell hardest on the AI complex, where the Philadelphia semiconductor index shed 10% in a single session. A buildout underwritten on cheap money is now meeting a market that no longer believes money will get cheap.
The buildout outran the balance sheet
The five largest US cloud builders have committed a combined $745 to $775 billion of capex for 2026, close to double the roughly $410 billion they spent in 2025 and an 82 to 89% jump in a single year.
| Hyperscaler | 2026 capex guide |
|---|---|
| Amazon | ~$200B |
| Alphabet | $180-190B |
| Microsoft | ~$190B (incl. ~$25B component inflation) |
| Meta | $125-145B |
| Oracle | ~$50B |
| Combined | ~$745-775B (+82-89% YoY) |
The trouble is how it is funded. Hyperscalers have historically put about 40% of operating cash flow into capex; in 2026 that ratio has climbed toward 90 to 100%. Amazon's free cash flow collapsed roughly 95% year on year, to about $1.2 billion. The shortfall is covered with debt and leases. Moody's counts roughly $662 billion of signed-but-not-commenced data center commitments, more than the group carries in on-balance-sheet borrowing. Oracle alone holds a $523 billion performance-obligation backlog, anchored by a $300 billion compute contract with OpenAI, a company itself on pace to lose around $14 billion this year. The money runs in a loop: Nvidia funds OpenAI, OpenAI commits to Oracle, Oracle buys Nvidia silicon, and the same names backstop CoreWeave, which signed a $21 billion capacity deal with Meta and raised an $8.5 billion term loan plus a $3.1 billion follow-on. NBC puts the web of cross-investment at more than $800 billion.
Chips boom, power is the ceiling
Demand at the silicon layer is not in doubt. Nvidia reported $81.6 billion of revenue for the first quarter of FY2027, up 85%, with the data center line alone at $75.2 billion, a gain of 92%, and guided the current quarter to $91 billion. Blackwell now accounts for 71% of high-end GPU shipments, while the next-generation Rubin has slipped to 22% on HBM4 validation and liquid-cooling delays. Custom silicon is growing faster than merchant GPUs: Broadcom booked $10.8 billion of AI revenue in the second quarter, up 143%, guided to roughly $56 billion this year, and now sees a line of sight beyond $100 billion in FY2027. Its decision not to raise that guidance on June 4 was the proximate trigger for the rout.
The ceiling is electricity. Morgan Stanley models a 126 GW jump in global data center demand through 2028 against a US supply shortfall of roughly 49 GW, with transformer lead times of two to four years and grid-connection queues that run past four. As much as 30 to 50% of the large data centers slated for delivery in 2026 may slip or be cancelled. That turns the capex numbers above into a ceiling, not a floor.
Revenue is real, and so are the losses
The models kept arriving faster than enterprises could absorb them. GPT-5.5, released April 23, leads ARC-AGI-2 at 85.0% and prices at $5/$30 per million tokens with a 1M-token context window. Claude Opus 4.8, out May 28, scores 84% on browser-agent tasks at $5/$25, and Google's Gemini 3.1 Pro undercuts both at $2/$12. All four major labs, xAI's Grok 4.3 among them, have made agentic, tool-using workloads the new battleground.
The genuinely new fact is revenue. Anthropic crossed $30 billion in ARR in April and, in a confidential S-1 dated June 1, projected $10.9 billion of second-quarter revenue and $559 million of operating profit, its first profitable quarter, on a run-rate near $47 billion. OpenAI sits around $25 billion annualized, with ChatGPT past 1 billion monthly users. Yet capex still outweighs monetization by roughly 10 to 1, and the productivity payoff is contested. MIT's NANDA project found that 95% of enterprise GenAI pilots delivered no measurable P&L impact, and Goldman's chief economist judged AI's 2025 contribution to US growth "basically zero".
The race to the public markets, and the first real test
| Lab | Valuation | Revenue run-rate | Public-market status |
|---|---|---|---|
| Anthropic | $965B (Series H) | ~$47B (May) | Confidential S-1, Oct window |
| OpenAI | $852B (Mar round) | ~$25B (Feb) | Confidential S-1, Sept target |
| xAI | $230B (Jan) | n/a | Folded into SpaceX |
| Safe Superintelligence | $32B (Apr '25) | none | Private, no product |
Anthropic's $65 billion Series H, struck at a $965 billion valuation, vaulted it past OpenAI as the most valuable private AI company, its compute suppliers (Amazon, Nvidia, Samsung, SK Hynix, Micron) now sitting on the cap table beside its customers. OpenAI closed its own $122 billion round at $852 billion on March 31 and filed confidentially weeks later, aiming at a September listing north of $1 trillion. Anthropic's filing also flags a Pentagon supply-chain-risk designation that, by its own account, could jeopardize federal revenue.
Whether those listings clear at anything close to consensus is the cleanest test of the cycle.
FOMO has proven a stronger incentive than poor stock performance.
That was Goldman's own read on why the hyperscalers keep spending. The firm's head of equity research, James Covello, is less convinced, arguing the economics look "more questionable today than two years ago". Michael Burry has backed the bear case with $912 million of Palantir puts and $187 million of Nvidia puts. The bulls answer with momentum: first-quarter AI capex hit $174 billion, about 2.4% of GDP, and Wells Fargo's Ohsung Kwon told clients to "own AI" and not fight the tape.
Our own read sits between the two. The spending is structurally higher than we modeled, and the leading labs now post real, fast-growing, occasionally profitable revenue, so this is not a 1999 of pre-revenue shells. But the buildout is increasingly debt-funded, the cash flows are reflexively circular, GPUs depreciate over three to five years, and the whole structure is being repriced against a Fed that may hike rather than cut. We would own the cash-generative compute layer into strength, keep the leveraged infrastructure names on a short leash, and treat the near-trillion-dollar IPOs as the binary they plainly are.
VI. Venture Capital & Private Markets
Private markets in 2026 read as a record and feel like a famine, depending on which row of the table you stop at. We expected the thaw to come from Fed cuts and a broadening market. Capital did come back. What it did not do was revert. It concentrated harder than at any point in the history of the asset class, and the cuts we penciled in never showed. By early June, futures were pricing somewhere between 66% and 70% odds of an October hike rather than a cut, which quietly rewrites every valuation problem below.
A record quarter almost nobody participated in
On paper, Q1 2026 was the best quarter venture capital has ever recorded. KPMG counted $330.9 billion across 8,464 deals. Crunchbase, screening more tightly, put the figure near $297 billion. Either way it is a nominal all-time high, and AI took roughly 80% of every global venture dollar, up from 55% a year earlier.
The footnotes invert the story. Five names did almost all the lifting: OpenAI ($122B), Anthropic ($30.6B in the quarter), xAI ($20B), Waymo ($16B) and Databricks ($7B), about $195.6 billion between them. That is close to 59% of KPMG's global total and nearer two-thirds on Crunchbase's narrower base. Beneath the megadeals, the floor gave way. Global deal count fell about 15% to its lowest level since late 2016, 61% below the Q1 2022 peak. Seed dollars rose 31% year-on-year even as seed deal count fell 30%, bigger checks written into fewer companies. Series A now typically asks for $3M to $5M of ARR, up from $2M in 2021. Strip out AI and, by some estimates, real-terms non-AI venture ran below where it sat in Q1 2020.
May only sharpened the pattern. Anthropic's $50B Series H, part of a $65B raise, was the largest single-month round on record and pulled May's global total to $92 billion, the second-biggest month ever.
Harry Stebbings and the wider 20VC orbit have spent the spring narrating the consequences, and the data backs the alarm. Five firms captured 73.1% of all LP capital raised in Q1. The SaaStr founder Jason Lemkin, on a widely shared episode with Stebbings, put the incentive plainly:
Why struggle pretending you can do 8x over 20 years on seed when you write one big check into a winner and achieve liquidity in a quarter of the time?
Rory O'Driscoll supplied the structural fear. Product-market fit that once held for five years in software can now erode in five weeks, shorter than a fund's holding period. A newer line item is surfacing too. Salesforce reportedly spends $300 million a year on Anthropic tokens for coding, and Mercor's chief executive told Stebbings his company already spends more on tokens than payroll.
The exit window finally cracked open
Here is the genuine surprise, the one place our "frozen until cuts arrive" assumption proved too gloomy. Global exit value hit $413.5 billion in Q1, the most since late 2021, and the pipeline behind it is enormous and dangerously top-heavy.
| Company | Valuation | Latest round | Public-market status |
|---|---|---|---|
| SpaceX (incl. xAI) | ~$1.77T target | xAI merger, Feb 2026 | Pricing June 11, up to $75B raise |
| Anthropic | ~$965B | $65B Series H, May 2026 | Confidential S-1 filed June 1, Oct target |
| OpenAI | ~$852B | $122B round, Mar 2026 | Preparing confidential S-1 |
| Stripe | ~$159B | Feb 2026 tender offer | No timeline |
| Databricks | ~$134B | Series L, Dec 2025 | Holding out past 2026 |
SpaceX is set to price on June 11 at $135 a share, a roughly $1.77 trillion valuation and up to $75 billion raised, which would make it the largest IPO in history, with the book reportedly about 2x oversubscribed. Anthropic filed its confidential S-1 on June 1, Morgan Stanley, Goldman Sachs and JPMorgan leading, October the target. Its revenue run-rate climbed from about $9 billion at the end of 2025 to roughly $47 billion by late May. The deals already done split the verdict and carry their own warning. CoreWeave is up about 359% from its March 2025 listing; Klarna trades roughly 62% below its September 2025 offer price. Goldman trimmed its 2026 outlook to about 100 deals from 120 while holding a $160 billion proceeds target, betting the mega-listings carry the volume.
M&A runs the same K-shaped split. Q1 global volume hit $861.1 billion, up 9.7% and the strongest start since 2021, even as deal count fell about 30% and the value of deals above $5 billion jumped 149%. The signature transaction is the $55 billion take-private of Electronic Arts by PIF, Silver Lake and Affinity Partners, the largest all-cash sponsor buyout ever, cleared through HSR in February. BlackRock's GIP and EQT are taking AES private at $33.4 billion, explicitly to feed data-center power demand. Secondaries have hardened into a third exit channel, $106.3 billion in 2025 against roughly $50 billion in 2024. That market may shrink just as the others open: if SpaceX, Anthropic and OpenAI all list, analysts expect secondary volume to drop 30% to 40% as the most-traded names leave the pool.
Buyout shops are still waiting on the cut that never came
Private equity is where our January rate call stings most. Distributions held at just 14% of NAV in 2025, the lowest reading since the 2008-09 crisis and a fourth straight year below 15%, with roughly 32,000 unsold companies worth an estimated $3.8 trillion parked in portfolios. Rolling 12-month fundraising fell to $373 billion, the weakest since 2017, and flagship funds are closing about 19% below target. So sponsors are manufacturing the liquidity the market will not give them. Continuation-vehicle activity grew 62% year-on-year and now drives roughly one in five sponsor exits, while dividend recaps neared a record $28.7 billion in a single month last November. With SOFR near 3.7% and a hike, not a cut, now the base case, the 2021 to 2023 vintages underwritten at 6x to 7x EBITDA carry the most stress.
The whole structure now rests on three or four tickers clearing the public market this autumn. If SpaceX and Anthropic price near their marks, liquidity flushes back to LPs and the 2027 vintages get funded. If the October hike lands first and the window shuts, this spring's records will read as the top, and the long tail of startups already starved of capital faces a far colder second half.
VII. Global Economies & Geopolitics
The most important number in the world economy this year was not a growth rate or a policy rate. It was the price of a barrel of oil. Our January outlook, like most of the Street's, underwrote a soft landing: a few Fed cuts, the S&P 500 drifting toward 7,500, and mean reversion to do the rest. We got the index level roughly right and the regime badly wrong.
What rewrote the year was not the Fed. On February 28 the United States and Israel struck Iran; on March 4 Tehran closed the Strait of Hormuz and choked off roughly 20% of seaborne crude and LNG. Brent leapt from a $72 pre-conflict base to above $112 by late March and peaked above $118 in late April, despite the fragile April 8 ceasefire. It still trades between $93 and $106. That shock is the connective tissue of this report. Inside a single quarter it reaccelerated inflation across every major economy and flipped three central banks from easing to tightening.
| Economy | Latest growth | Inflation | Rate signal |
|---|---|---|---|
| United States | Q1 GDP +1.6% | Core PCE 3.3% | Hike odds ~73% by year-end |
| China | Q1 GDP +5.0% | CPI 1.2% | Easing bias; RRR cuts flagged |
| Eurozone | 2026 GDP ~1.0% (f) | HICP 2.7% (f) | ECB seen hiking to 2.25% Jun 11 |
| United Kingdom | Q1 GDP +0.6% q/q | CPI 2.8% | BoE on hold at 3.75% |
| Japan | FY26 GDP 0.5% (f) | Core CPI 2.8% (f) | BOJ 0.75%, hike likely Jun/Jul |
| India | FY26 GDP +7.7% | CPI ~5.1% (f) | RBI on hold at 5.25% |
| South Korea | Exports +53.2% (May) | n/a | Chip-led; KOSPI +100% YTD |
The United States: the Fed loses its easing path
First-quarter GDP was revised down to 1.6% annualized from a 2.0% advance read, but the composition was sturdier than the headline. Private domestic demand grew 2.4%, and nonresidential investment jumped about 10% as companies poured money into computing and AI gear. The economy is not rolling over, and that is precisely the Fed's problem. May's jobs shock was the labor market refusing to hand the new chair the slack a cut would require.
What boxes the Fed in is tariffs sitting on top of prices that were already sticky. The Yale Budget Lab pegs the cumulative tariff regime at about $1,500 per household, the largest US tax increase as a share of GDP since 1993, and households feel it. Michigan sentiment sat at 44.8 in May, near its 2022 trough, with one-year inflation expectations at 4.7%. The fiscal side offers no relief valve: a 12-month deficit running $1.6 trillion and headed toward $1.9 trillion, against public debt near 100% of GDP. A government borrowing that heavily, into inflation that sticky, is not a backdrop that lets a central bank cut.
China: exports carry a soft-demand economy
At the March Two Sessions, Beijing set its lowest growth target in three decades, 4.5% to 5%, an honest admission that tariffs and soft domestic demand had made the old 5%-plus aspiration untenable. Q1 then printed exactly 5.0%, but the engine was external. Exports rose 14.7% and high-tech manufacturing 12.5%, while retail sales stayed weak and consumer confidence sat near multi-year lows. This is not a consumption recovery.
Prices tell the same story. CPI was just 1.2% in April, and PPI crept positive in March for the first time since September 2022, both driven largely by imported energy rather than reviving demand. Property is still the drag: new-home prices fell 3.5% in April, a 34th straight monthly decline. What works is trade redirection and tech self-sufficiency. Early-year exports rose 21.8%, the US share shrinking as ASEAN, the EU, and Africa absorbed the volume; on the tech side, Huawei's Ascend chips completed training of DeepSeek's 1.6-trillion-parameter V4 model on domestic silicon, no Nvidia required. Goldman sees 4.8% growth for the year.
Asia: Japan's liftoff, India's 7.7%, and the chip supercycle
The clearest expression of the AI capex wave we flagged in January sits in Northeast Asia. South Korean exports hit a record $87.75 billion in May, up 53.2%, the fastest pace since 1984, with semiconductors alone up 169%. Oxford Economics notes that chip export value is climbing 80.7% against just 28.3% in volume, the widest spread on record and a clean read on pricing power in advanced memory.
Japan is the more consequential rates story. The BOJ held at 0.75% in a split 6-3 vote, lifted its core CPI view to 2.8%, and for the first time acknowledged the risk of a wage-price spiral. With real wages positive for a third straight month and spring wage talks pointing above 5%, a June or July hike is now the base case, even as the oil shock cut the bank's growth forecast to 0.5%. India remains the fastest-growing major economy, printing 7.7% for FY26, though the RBI held at 5.25% and trimmed its FY27 outlook to 6.6% as a near-record-low rupee and dear crude bit. Beneath all of it, ASEAN keeps winning the supply-chain reshuffle: Vietnam's Q1 FDI rose 42.9%, much of it Chinese capital routing through the region to bypass tariffs.
Europe and the geopolitical map
Europe took the shock hardest. Gas spiked roughly 50% in the conflict's first week, and the EU's research arm warns of €80/MWh gas and $180 oil if Hormuz stays constrained into Q4. That was enough to flip the ECB. Having cut to 2.00%, it is now expected to hike to 2.25% on June 11, while its own forecasters mark 2026 inflation up to 2.7% and growth down to 1.0%, a stagflationary mix. Germany is the offset, running an €83 billion defense budget alongside a €500 billion infrastructure fund, though much of the defense money leaks to foreign suppliers. France is the soft spot, its OAT-Bund spread near 69bp on chronic political deadlock. The UK looks steadier, with Q1 GDP at 0.6% and the BoE on hold at 3.75%.
The trade architecture, meanwhile, was rebuilt in the courts. The Supreme Court struck down the IEEPA reciprocal tariffs 6-3 in February; the administration pivoted to Section 122 and 301 authorities and signed nine bilateral deals that PIIE reads as engineered to pull partners away from China. The tech cold war sharpened in step. Washington closed the loophole that had let Chinese firms buy Nvidia chips through offshore units, and at their May 14 Beijing summit Xi warned Trump that mishandling Taiwan could put the entire relationship at risk. Russia and Ukraine remain stuck, a May ceasefire yielding prisoner swaps before collapsing over Donbas. For markets the order of risk is clean: Hormuz sets the oil price, the oil price sets inflation, and inflation sets how long the Fed, ECB, and BOJ stay on the hawkish side of neutral.
VIII. Commodities, FX & Digital Assets
Gold spent the first month of 2026 going vertical, then spent the next four handing most of it back. That round-trip is the year's commodity story in miniature, and it splits the field cleanly in two. What the Fed can touch, gold and silver and crypto, has surrendered its gains as the cuts curdled into hike talk. What the Fed cannot touch, the copper in a transformer, the barrel held hostage in the Strait of Hormuz, the megawatt a data center needs by Tuesday, has stayed bid on nothing but physical scarcity. That divide is the whole game right now.
| Asset | 2026 high | Early June 2026 | From the high |
|---|---|---|---|
| Gold | ~$5,589/oz (Jan 28) | ~$4,400/oz | down ~21% |
| Silver | $121.62/oz (Jan 29) | ~$67.80/oz | down ~44% |
| Copper (COMEX) | $6.19/lb (May 13, record) | near record | roughly flat |
| Brent crude | above $118/bbl (late Apr) | ~$97/bbl | down ~18% |
| Bitcoin | ~$126,000 (Oct 2025) | ~$62,000 | down ~51% |
| Ether | record (Aug 2025) | ~$1,600 | down >40% |
The metals round-trip
The first quarter was historic. Gold cleared $5,000 for the first time, peaked near $5,589 an ounce on January 28, and averaged a record $4,873 for the quarter. Silver ran hotter still, hitting an all-time high of $121.62 on January 29, up about 144% on the year. Then the macro turned. The May jobs shock flipped the Fed toward a hike, and gold erased its entire 2026 gain in a single week, sliding to about $4,400 by June 5. Silver fell to near $67.80, a drawdown of about 44% from its January high. Metals Focus put it plainly: the Iran war "added downward pressure by raising inflation expectations, lifting sovereign yields and strengthening the case for higher interest rates."
Our January call for gold at $5,000 was right for a quarter and then some. The metal has since handed back about 21% from the top, but the structural bid is intact rather than gone: central banks net-bought 244 tonnes in Q1, an annualized pace near 975 tonnes, and J.P. Morgan still carries a year-end base case near $6,000 if the Fed stays put.
Copper is the cleaner trade, and it vindicated our $13,500 call almost to the dollar. COMEX three-month copper hit a record $6.19 a pound, about $13,650 a tonne, on May 13, as US buyers front-ran a possible Section 232 tariff. Goldman Sachs has since lifted its year-end LME target to $13,735 a tonne, pointing to a 640,000-tonne deficit outside the US, permitting timelines of 15 to 17 years, and delayed restarts at Grasberg and Kamoa-Kakula. Uranium has settled around $86 a pound, held up by Kazatomprom constraints and a fresh layer of nuclear demand from AI data centers.
Energy: a war premium and a power bill
Oil is where the Hormuz closure cashes out. The IEA called the shutdown of a chokepoint carrying a fifth of the world's seaborne oil and LNG "the largest supply disruption in the history of the global oil market." Brent breached $100 on March 12, peaked above $118 in late April, then eased to about $97 by early June as Trump's May ceasefire push drained the war premium, which still leaves it some 48% above a year earlier. OPEC+ has answered with four straight 188,000 bpd quota hikes, but these are paper barrels: Saudi Arabia's 10.29 million bpd quota sits far above its actual output near 7.76 million.
Gas is where the harm is structural. A March strike on Ras Laffan knocked out an estimated 17% of Qatari LNG capacity, and repairs run three to five years. European TTF jumped 55%, Asian spot LNG spiked to about $15.77 per MMBtu, and US Henry Hub held as a relative haven near $3.30 as record export volumes backfilled the gap. Underneath all of it sits the AI power bill. PJM wholesale costs rose 75.5% year on year to $136.53 per MWh, with the market monitor pinning 63% of that on data-center load, and the capacity auction cleared at $329 per MW-day, eleven times the level of two years ago.
A dollar that refused the script
The consensus going in was a softer dollar. Instead the DXY sits near 99 to 100, firm and at the top of its 2026 range, because a Fed that might hike is the best friend a currency can have. The yen is the stress point: USD/JPY near 159 to 160 has forced about $73 billion of Japanese intervention against a Bank of Japan still parked at 0.75%. The yuan has gone the other way, firming roughly 4% to a 15-month high near 6.76. The slow burn runs underneath all of it: the dollar's reserve share has slipped below 57% for the first time since 1995. No collapse, but the direction is not in doubt.
Crypto's macro re-rating
Digital assets are taking the re-rating hardest. Bitcoin has dropped into the $60,000 to $64,000 range, more than 50% below its roughly $126,000 high last October. The trigger was flows: spot ETFs bled $4.4 billion over 13 straight sessions, pulling assets from about $104 billion to roughly $80 billion, with BlackRock's IBIT alone shedding $980 million in a single week. Citi's Alex Saunders put his finger on the real worry, the absence of fresh buyers rather than any one seller. Ether is off about 33% in a month near $1,600, though staking has climbed to 32.4% of supply, a sign long-term holders are digging in. The bright spots are structural. Stablecoins stand at a record $321 billion and are entering active GENIUS Act rulemaking, and 40 cents of every venture dollar in crypto last year went to AI-linked projects. Even in crypto, the most rate-sensitive corner there is, the next cycle is being built around the one thing the Fed cannot touch.
IX. What We Are Watching
Strip away the eight sections and one shape remains. The market's organizing assumption for the past year, that money would soon get cheaper, has quietly expired, and remarkably little has been repriced for its absence. Equities sit at records. Credit spreads sit at their tightest since 2007. Private marks have barely moved. All of it was underwritten for a Fed that was supposed to be cutting by now and is instead arguing about whether to hike.
The next sixty days force the question into the open. Kevin Warsh chairs his first meeting on June 17, where the task is no longer to decide how much to cut but to keep the market from pricing a hike outright. The Bank of Japan moves the day before, and a yen that finally snaps could send the world's largest pool of foreign Treasury buyers home at the worst imaginable moment. Then come the listings. SpaceX prices on June 11 and Anthropic targets October, and those two order books are the first time public investors get to vote on whether the economics behind a trillion dollars of AI spending actually clear.
We opened the year calling the cut a base case. We close the first half watching the market realize it was only ever an assumption, with a leveraged, capex-heavy AI buildout that never once priced in expensive money standing directly in its path. That collision, not any single data print or any single IPO, is the story of the rest of 2026. We would rather own the things that trade on physical scarcity than the things that trade on faith in the Fed, and we would treat every date on that June and October calendar as the coin-flip it actually is.
How we put this together
This is our mid-year follow-up to the January 2026 outlook, and we have tried to grade our own homework honestly. Where the January calls held, we say so. Where they broke, we say that too. The figures run through June 6, 2026 and draw on central-bank releases, company filings, earnings calls, sell-side research, the venture and private-market conversations we follow week to week, and the market data we watch day to day. Forecasts and price targets are the relevant institutions' own.
Anwaar Malik
This research is powered by AllMind. This analysis was synthesized using our deep research engine, which processes institutional research, central-bank communications, earnings transcripts, filings, and macroeconomic data to surface actionable investment insight. See it in action.
Disclaimer
This report is provided for informational purposes only and does not constitute investment advice, an offer to sell, or a solicitation of an offer to buy any securities. The views expressed represent the author's opinions as of the publication date and are subject to change without notice.
Past performance is not indicative of future results. All investments involve risk, including possible loss of principal. The information contained herein has been obtained from sources believed to be reliable, but accuracy cannot be guaranteed.
This analysis may contain forward-looking statements that involve risks and uncertainties. Actual results may differ materially from those projected. Readers should conduct their own due diligence and consult with qualified financial advisors before making investment decisions.
AllMind and the author may hold positions in securities mentioned in this report.