
State of M&A and Private Markets, June 2026: A $4.9 Trillion Rebound, Underwritten on Money That Never Got Cheaper
AllMind's June 2026 guide to global M&A, private equity, private credit, and venture capital, and why the great deal rebound now meets a Fed that may hike.

Published June 7, 2026

In this article
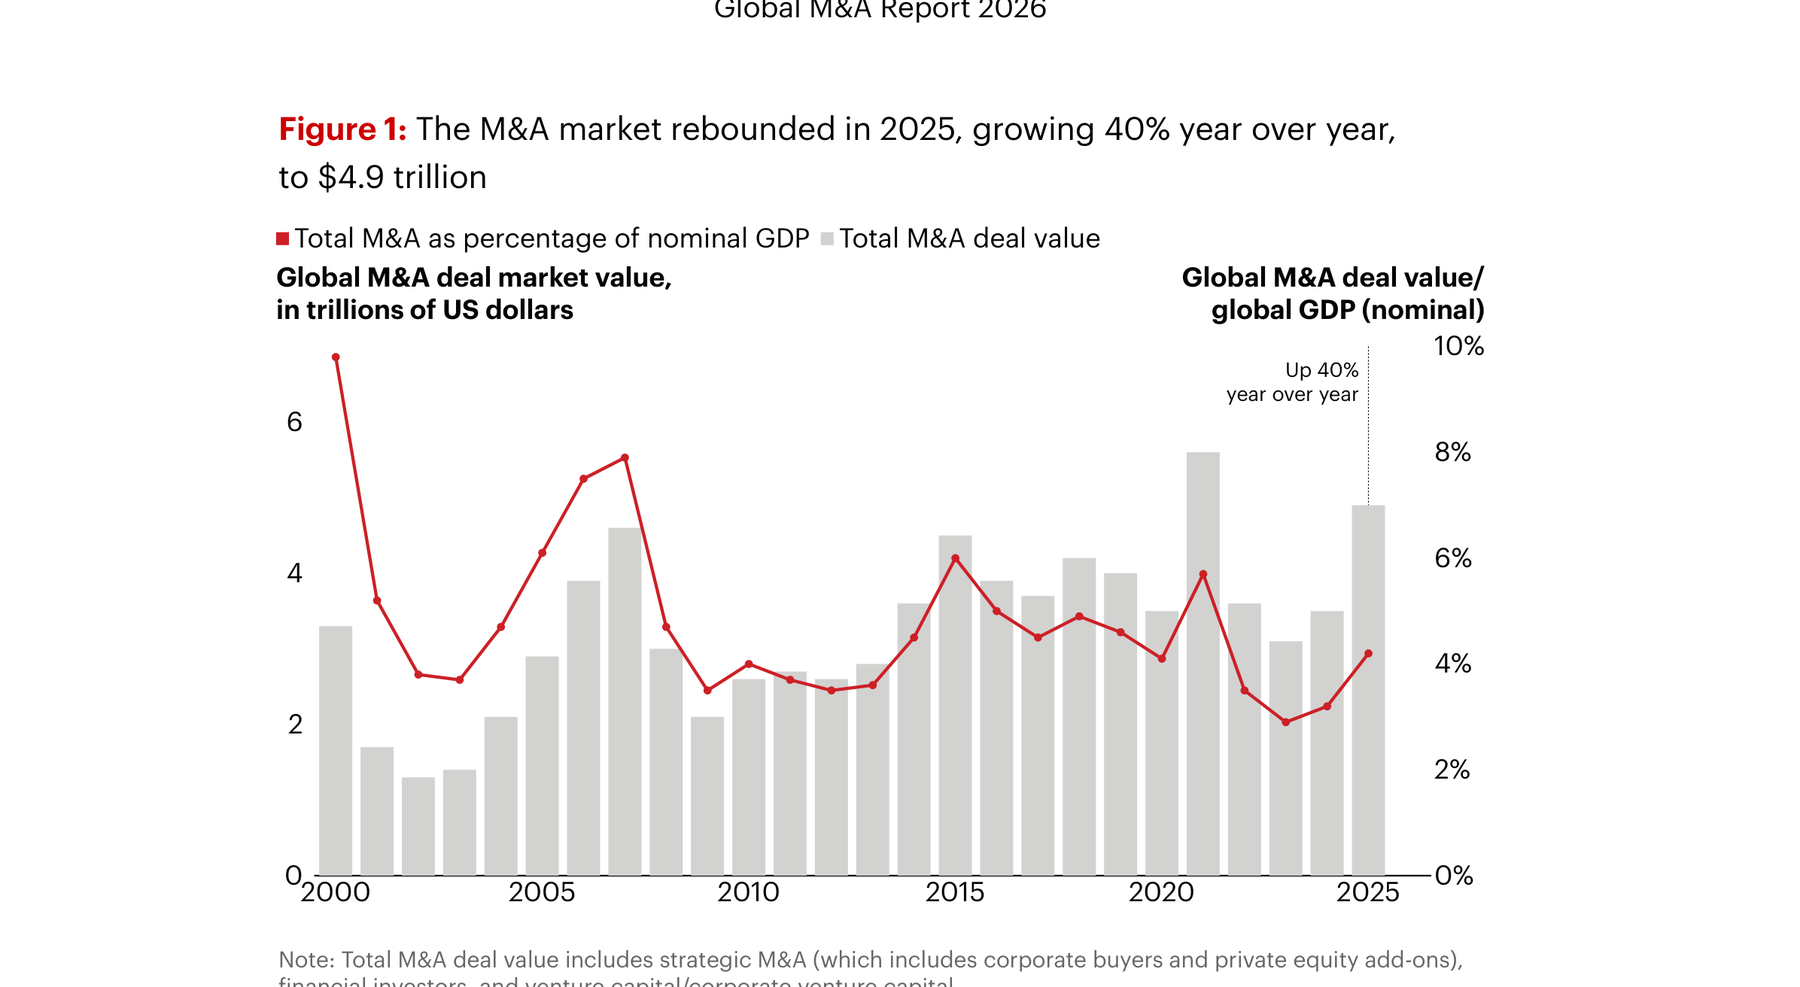
Global M&A deal value rose about 40% in 2025 to roughly $4.9 trillion, the second-biggest year on record, with the gain skewed almost entirely toward megadeals. Source: Bain & Company.
For three years, dealmakers sat on their hands. In 2025 they finally moved. Global M&A value climbed about 40%, to roughly $4.9 trillion, a figure the market has topped only once, in the 2021 mania. Buyout shops put 44% more capital to work. Venture money came roaring back behind anything wearing an AI label, and the IPO window, welded shut since 2022, finally cracked. After the longest deal recession in a generation, the animal spirits were back.
There was a catch, and it is the whole story of this guide. Every house outlook written at the turn of the year, the Bain, McKinsey, and KPMG reports we read most closely, rested on the same quiet assumption: that the cost of capital would keep falling through 2026. Deloitte said it plainly, crediting the rebound to monetary policy that "lowered the cost of capital." That assumption has since broken. The Federal Reserve has not cut once this year, core inflation is stuck near 3.3% after Iran's closure of the Strait of Hormuz put a war premium back into oil, and as of June the futures market prices roughly a 70% chance of a rate hike before December. The deal economy was financed on the expectation of cheaper money. It got more expensive money instead.
The rebound was real. The premise underneath it was wrong. That gap is what the back half of 2026 has to resolve.
That momentum carried into 2026, half on real urgency and half on sheer inertia. First-quarter global M&A reached $861.1 billion, the best start since 2021, and venture funding set a nominal record of $330.9 billion. Scratch either figure, though, and the same thing falls out. A few enormous deals are carrying the whole market while the broad middle barely moves. M&A deal count actually fell about 30% in the quarter. Pull the five biggest AI rounds out of that venture record and the total shrinks by nearly 60%. Call it a barbell: the weight sits at the two ends, and the bar between them is thin.
What follows is our read on where the deal economy actually stands in mid-2026: who is transacting and why, where the money is coming from now that banks and cheap debt are not the answer, and which of the marquee events on the June-to-October calendar will decide whether the rebound was a beginning or a top.
Key Takeaways
- The 2025 rebound was genuine and concentrated. Global M&A rose about 40% to roughly $4.9 trillion, but deals above $5 billion drove more than 73% of the entire increase, and the share of corporate cash going to M&A fell to a 30-year low of 7% as buybacks, dividends, and AI capex won the budget fight.
- Cost of capital, not appetite, is now the binding constraint. With the Fed on hold at 3.50% to 3.75% and a December hike in play, an LBO struck at a 14x entry multiple and 9% debt now needs 10% to 12% annual EBITDA growth to clear a 2.5x return, double the bar of a decade ago. Bain's own shorthand: "12 is the new 5."
- Private equity is sitting on a record overhang. Roughly 32,000 unsold companies worth about $3.8 trillion are stuck in funds, distributions have fallen to about 14% of net asset value (the lowest since the financial crisis), buyout fundraising dropped to a 2017 low, and average hold periods have stretched to seven years.
- Manufactured liquidity has become the main exit. The secondaries market hit a record near $240 billion in 2025, GP-led continuation vehicles ran near $115 billion, dividend recaps set a record at $94 billion, and NAV lending is institutionalizing fast. None of it returns the cash that funds a new vintage.
- Private credit is taking its first real stress test. The default rate hit a record near 6%, more than half of newly added payment-in-kind features are signs of distress, and a Q1 wave of redemption requests forced Apollo and BlackRock's HPS to gate retail credit funds while Blackstone injected $400 million to avoid it.
- Venture is an AI monoculture. AI took roughly 80% of every Q1 2026 venture dollar; OpenAI ($122B), Anthropic ($30.6B), and xAI ($20B) alone were more than half the global quarter. Anthropic closed a $65 billion round in May at a $965 billion valuation on a $47 billion revenue run-rate. Adjusted for inflation, everything else is below where it sat in early 2020.
- The exit window is selectively open and about to be tested. SpaceX prices what would be the largest IPO ever near June 11 (about $1.77 trillion), with Anthropic targeting October and OpenAI September. Their order books are the first public vote on AI-era private valuations.
- Sovereign wealth is the new cornerstone. Gulf and Asian funds backed about $146 billion of deals in 2025, anchoring the $55 billion Electronic Arts take-private, the $40 billion Aligned Data Centers deal, and Anthropic's mega-rounds. Patient sovereign capital is filling the hole that expensive debt left.
- Power and AI are rewriting where the money goes. The hottest deal theme is not a sector, it is electricity: hyperscalers and infrastructure funds are buying utilities, renewable developers, and data centers outright, from Alphabet's purchase of Intersect Power to the $33.4 billion take-private of AES.
Contents
| Section | Coverage |
|---|---|
| I. Executive Summary | The rebound-meets-the-rate-wall thesis |
| II. The Great Rebound | 2025's surge, the value-count split, megadeals, scope over scale |
| III. Dealmaking by Sector | Tech and AI, healthcare, energy and power, financials, industrials, consumer |
| IV. Private Equity | The buyout math, the exit drought, manufactured liquidity, fundraising |
| V. Private Credit | The default rate, BDC gating, and the data-center credit boom |
| VI. Venture Capital | The concentrated record, the AI premium, and the non-AI famine |
| VII. The Exit Window | SpaceX, Anthropic, OpenAI, and the secondaries safety valve |
| VIII. Cross-Border, Sovereign Capital & Regulation | Americas inflows, Gulf SWFs, Japan, China, antitrust |
| IX. What We Are Watching | The June-to-October events that settle the year |
Bottom Line Up Front
| Theme | Signal | View |
|---|---|---|
| Global M&A | Rebound, concentrated | Up ~40% to roughly $4.9T in 2025 and $861.1B in Q1 2026, but megadeals (over $5B) drove 73% of the gain and deal count fell ~30%. A two-track market: mega-cap transformation on top, a frozen mid-market below. |
| Deal financing | Open but expensive | Markets cleared the $20B Electronic Arts debt package, the largest since the financial crisis, but at all-in costs of 7% to 9%. The refinancing wave is over; only genuine new-money deals remain. |
| Private equity | Crowded, illiquid | A record ~$3.8T of unsold assets, DPI near 14% of NAV, fundraising at 2017 lows. Sponsors are manufacturing liquidity rather than waiting for the cut that never came. |
| Buyout math | Repriced | At 14x entry and ~9% debt, an LBO needs 10% to 12% EBITDA growth for a 2.5x return. The 2021 to 2023 vintages underwritten on cheap money carry the most stress. |
| Private credit | Stress test | A record ~6% default rate, retail BDC gating (Apollo, BlackRock HPS), and FSB scrutiny of $220B to $500B of bank lines, set against a fast-growing new frontier in AI data-center lending. |
| Venture capital | AI monoculture | A $330.9B Q1 record that is ~80% AI and barely real ex-AI. Late-stage AI valuations carry a ~190% premium; non-AI seed and Series A are in a quiet depression. |
| Secondaries | Structural, not cyclical | A record ~$240B in 2025. Continuation vehicles are now ~15% of all sponsor exits and the default tool when the IPO window is shut. |
| Mega IPOs | Binary | SpaceX (~June 11, ~$1.77T), Anthropic (October), and OpenAI (September) are the first public referendum on trillion-dollar AI marks. Treat each as a coin flip. |
| Sovereign wealth | Cornerstone | Gulf and Singapore funds anchored ~$146B of 2025 deals and now lead, not follow. PIF cutting its international target from 30% to 20% is the one shift to watch. |
| Power and infrastructure | Land grab | Electricity has displaced cost of capital as the swing variable for data-center assets. Utilities and renewable developers are being bought outright by tech and infra capital. |
| Regulation | Looser, sharper | A remedy-first FTC and DOJ cleared deals with divestitures and filed zero contested merger suits in Q1, while CFIUS hardened against China and the EU and UK rewrote their merger playbooks. |
I. Executive Summary
Mid-2026 is a strange time to be buying companies. Rarely has the case for transacting been stronger, and rarely has the cost of acting on it been higher. The strategic side almost makes itself. AI is rewriting what a company needs to own, supply chains are splintering along political lines, and private equity is sitting on a mountain of assets it badly needs to sell. The financing side is the opposite. The Fed has not cut once this year, the Hormuz oil shock has pushed inflation back up, and a market that spent 2025 betting on cuts now leans toward a hike. Deals are getting done into the teeth of that contradiction, which is exactly why they look the way they do: bigger, fewer, and paid for more and more with equity and sovereign money rather than cheap debt.
Start with the rebound, because it was real. Global M&A rose about 40% in 2025, the strongest year since 2021, and the momentum carried into a powerful first quarter. But the gain was almost entirely a megadeal phenomenon: a small cluster of very large transactions did nearly all the work while deal count fell, and the share of corporate cash devoted to M&A dropped to a 30-year low as buybacks, dividends, and the AI capital spending boom won the budget fight. Companies are not flush with cheap money chasing deals. They are picking a small number of bets they cannot afford to skip.
That same higher-for-longer regime is repricing everything downstream. In private equity it has frozen the exit and choked distributions to about 14% of net asset value, the lowest since the financial crisis, forcing sponsors to manufacture liquidity through a record $240 billion secondaries market, continuation vehicles, NAV loans, and dividend recaps. In private credit it has produced the asset class's first real stress test, a record default rate near 6% and a Q1 wave of redemption requests that gated retail funds at Apollo and BlackRock. In venture it has hardened the split between an AI sector financed at sovereign scale and a non-AI market that, adjusted for inflation, is running below early-2020 levels. And it has turned the marquee IPOs of the autumn, SpaceX, Anthropic, and OpenAI, into the cleanest test the cycle will get of whether trillion-dollar private marks survive contact with public investors.
We did not write a dedicated M&A outlook in January, so we are not grading our own deal forecast here. But our June read of the public markets made the call that frames this entire guide: the cuts were never a promise, only an assumption, and the market had repriced toward a hike. The deal market has not finished repricing for that same fact. Marks are barely off their highs, secondaries still clear near 90 cents on the dollar, and consensus still pencils Goldman's call for another near-record year of dealmaking. The playbook for the back half is narrower than the one the Street wrote in January: favor the buyers who do not need cheap debt, treat the exit calendar as a series of binary events, and remember that a deal that worked at a 4% cost of capital can destroy value at 9%.
II. The Great Rebound
Deals came back in 2025. That part is simple. What matters is how lopsided the comeback was. The headline numbers describe a boom; the distribution underneath describes a famine with a handful of palaces built on top of it. Miss that, and you will misread the whole market.
A rebound that almost nobody in the middle felt
The aggregates are genuinely strong. Bain puts 2025 global deal value up 40% at about $4.9 trillion; McKinsey, on a different basis, puts it up 43% at $4.7 trillion. Either way it is the second-best year on record and roughly 20% above the ten-year average. Total M&A climbed back to 4.2% of global GDP, from 3.2% the year before.
Then look at the count. Deal volume rose just 7% on Bain's numbers and was flat on McKinsey's. In the first quarter of 2026, that divergence widened into a chasm: value up about 10%, but the number of announced deals down roughly 30% to the fewest since 2016. The market is doing more dollars through far fewer transactions.
| Metric | 2025 full year | Q1 2026 | What it says |
|---|---|---|---|
| Global M&A value | ~$4.7T to $4.9T (+40%) | $861.1B (+9.7%) | Second-best year since 2021; strong start |
| Deal count | +7% (or flat) | down ~30% YoY | Fewer, much bigger deals |
| Deals over $10B | 60 (most since 2021) | 22 (a quarterly record) | The action is all at the top |
| M&A as share of corporate cash | 7% (30-year low) | n/a | Losing the budget to buybacks and capex |
What the table really shows is two separate markets wearing one name. One is a mega-cap market, where strategic logic and a strong balance sheet clear a deal at almost any interest rate. The other is a mid-market the cost-of-capital math has simply priced out. The palaces are real. So is the famine underneath them.
Megadeals and big bets
What powered the value line was a return of the transformational deal. Megadeals above $5 billion drove more than 73% of the entire increase in deal value, and the most striking fact in Bain's data is who made them: about 59% came from infrequent acquirers, companies that had done fewer than ten deals in a decade. Roughly four in ten of those megadeals were "big bets," priced at more than half the acquirer's own market value.
The 2026 roster reads like a list of companies that decided they could no longer wait. SpaceX absorbed xAI in an all-stock deal that valued the combined entity near $1.25 trillion, the largest merger ever recorded, though as a transaction between two Musk-controlled companies it flatters the quarter's totals and is best set aside. Cleaner examples abound: Devon Energy and Coterra merged in a $58 billion all-stock tie-up, Paramount Skydance agreed to take Warner Bros. Discovery for about $110 billion, McCormick agreed to absorb Unilever's food business for $44.8 billion, and Kimberly-Clark struck a $48.7 billion deal for Kenvue. Bain's warning hangs over all of them: the last time global deal value cleared $4 trillion, in 2021, the biggest bets split cleanly into outsized successes and outright disasters. A bet-the-company deal struck by a first-time acquirer, integrated through a tightening rate cycle, is exactly the kind of transaction that ages badly.
"Big bets are bold strategy moves by the CEO and board that require clear and early answers to fundamental questions that too often fail to get asked."
That is Bain's read, and it holds up. The urgency is real. The execution risk is just higher than the deal totals let on.
Scope beat scale, and the capital fight got harder
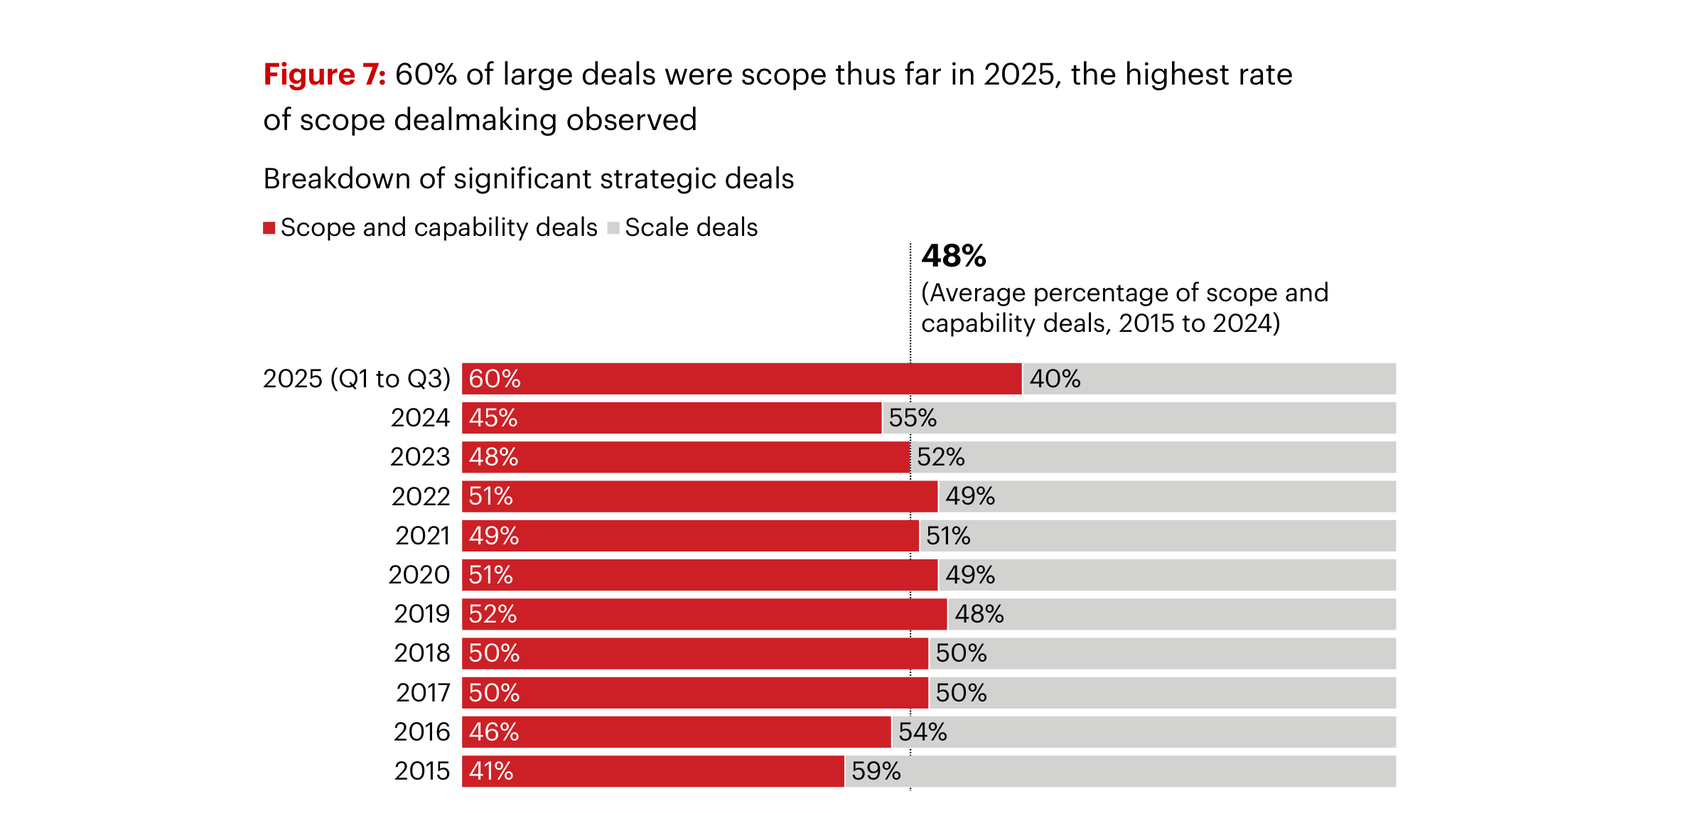
Scope deals, the kind aimed at new capabilities and revenue rather than cost cuts, hit 60% of large strategic transactions in 2025, the highest share on record. Source: Bain & Company.
The other defining shift was strategic. In the first nine months of 2025, 60% of deals over $1 billion were scope deals, aimed at buying capabilities and growth rather than cutting costs, the highest rate ever recorded and a reversal of the 2024 lean toward scale. In technology the figure was 94%; in healthcare, 86%. AI is the proximate cause: nearly half of all strategic tech deal value came from AI-native targets or deals that cited AI benefits. Scope deals are harder to integrate than scale deals, because revenue synergies are slower and more fragile than cost synergies, which raises the stakes on getting the people right.
The quietest number in the whole rebound is the one that says the most. Even as deal value surged, M&A's share of corporate cash spending fell to a 30-year low of 7%. The Magnificent Seven alone poured roughly $500 billion into capital expenditure and research through the third quarter, and across the market, buybacks, dividends, and AI infrastructure consistently won the capital-allocation fight. The bar for any deal to clear is no longer just strategic. It has to beat the alternative of simply building data centers and buying back stock, and in this rate environment that is a high bar.
III. Dealmaking by Sector
Beneath the aggregates, 2025 and early 2026 produced a handful of distinct sector stories, each with its own logic. Three threads run through all of them: AI as a forcing function, power as the new scarce input, and portfolio reshaping as the dominant strategic move.
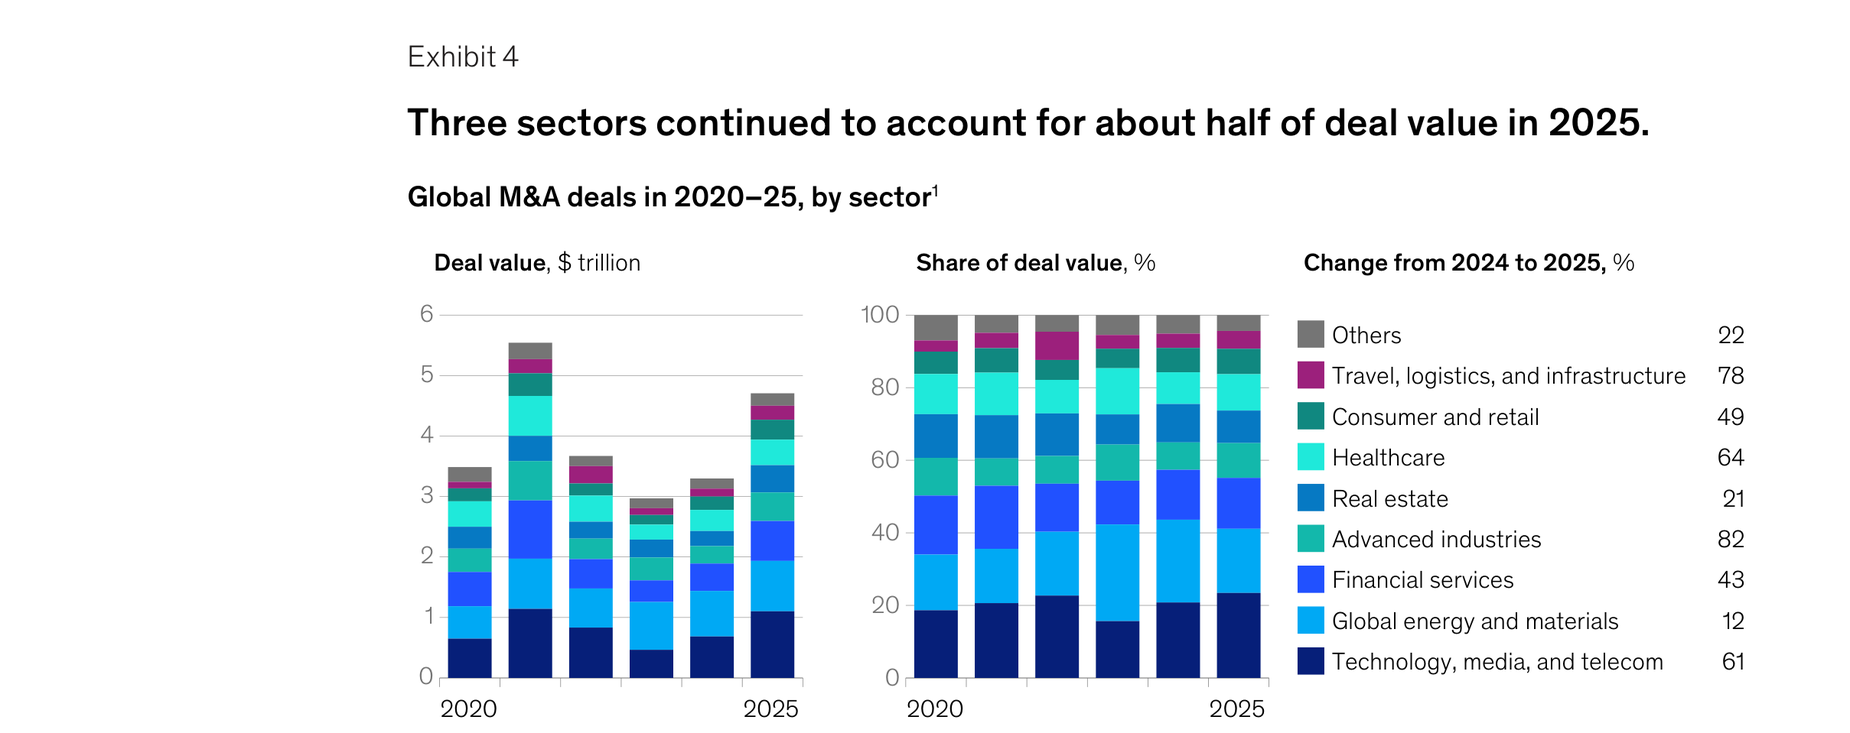
Technology, energy, and financials together accounted for about half of 2025 deal value, with advanced industries and healthcare posting the fastest growth. Source: McKinsey & Company.
Technology: the AI consolidation
Technology, media, and telecom was the largest sector, and technology M&A jumped 77% on the year. The marquee deals were about control of platforms: Alphabet's $32 billion purchase of Wiz, its largest ever, and Palo Alto Networks' roughly $25 billion deal for CyberArk reshaped cybersecurity around the question of which platform the capabilities flow through. The software take-private machine kept running, with Thoma Bravo closing its $12.3 billion deal for Dayforce alongside a sovereign co-investor.
Telecom was the one corner of tech that went the other way, with global value falling 37% to $80 billion as high financing costs punished the most leveraged subsector in the market. Charter's $34.5 billion deal for Cox alone was 43% of the global telecom total. The pattern is instructive: where deals need 5x to 6x of debt, higher-for-longer bites hardest.
Healthcare: the patent cliff forces the issue
Biopharma is dealmaking out of necessity. A patent cliff projected to wipe out nearly $300 billion of revenue by 2028 to 2030, with Merck's Keytruda and Bristol's Opdivo among the exposures, has top-20 pharma sitting on an estimated $1.2 trillion of firepower chasing a scarce pool of de-risked assets. The result is a flurry of disciplined bolt-ons: a single 12-day stretch in March 2026 produced seven deals worth $29 billion, from Merck's $6.7 billion purchase of Terns to Eli Lilly's $6.3 billion deal for Centessa. Medtech is in its own burst, with Abbott closing a $21 billion deal for Exact Sciences and Boston Scientific announcing $14.5 billion for Penumbra. Premiums have come down nearly 40% from their 2020-to-2024 average, and more than half of pharma deals now target early-stage assets, because the commercial-stage shelf is bare. The signal for anyone valuing the sector is that pharma is increasingly bidding for science rather than revenue, which makes its deal multiples a wager on clinical trials rather than cash flows.
Energy and power: the data-center land grab
The most structurally important deal theme of 2026 is not a sector at all. It is electricity. AI's power hunger has turned generation and grid access into the scarcest asset in the deal market, and the buyers are a new coalition of hyperscalers and infrastructure funds.
| Deal | Buyer | Target | Value | Driver |
|---|---|---|---|---|
| AES take-private | BlackRock GIP, EQT (+ CalPERS, QIA) | AES Corporation | $33.4B EV | Power for AI demand |
| Constellation / Calpine | Constellation Energy | Calpine | $26.6B EV | Largest US power producer |
| NRG / LS Power fleet | NRG Energy | 13 GW gas + VPP | $12B | Doubling generation |
| TXNM Energy | Blackstone Infrastructure | TXNM (PNM, TNMP) | ~$11.5B EV | Regulated grid access |
| Alphabet / Intersect Power | Alphabet | Intersect Power | $4.75B + debt | Owning generation outright |
Two moves capture the shift. Alphabet's $4.75 billion purchase of Intersect Power was the first time a hyperscaler bought a renewable developer outright rather than signing a power contract, and Meta contracted up to 6.6 gigawatts of nuclear capacity from TerraPower, Oklo, and Vistra in a single January announcement. Power availability, grid-queue position, and utility relationships now drive data-center deal premiums more than revenue multiples do. In oil and gas, by contrast, basin consolidation has matured into all-stock mergers of equals like Devon and Coterra, and the proposed $260 billion Rio Tinto and Glencore mining merger collapsed within a day over governance, a reminder that even the copper supercycle has limits.
Financials, industrials, and consumer: three different logics
The other big sectors each answer the same question, who can still afford to transact, in a different way. Financials had their strongest year since 2021, around $499 billion, and the tell is that the buyers spent their own balance sheets rather than borrowed money. Banks that fattened up during the high-rate years bought scale and capability at once, Capital One swallowing Discover for $35.3 billion to own a payments network outright, Fifth Third taking Comerica for $10.9 billion. The louder shift was in asset management, where any firm without a private-markets arm suddenly needed to buy one: Nuveen agreed to take Schroders for $13.5 billion and BlackRock absorbed the private-credit house HPS for $12 billion, deals that redraw the league tables rather than nudge them.
Industrials and defense rode the one tailwind no other sector had, government money. Europe's defense index rose 74% in 2025, handing primes like Germany's Rheinmetall and Italy's Leonardo a richly valued stock to spend, and a continent committed to rearmament gave them the demand visibility to underwrite shipyards and armored-vehicle makers with confidence.
Consumer is in the most violent rotation of all. The giants are doing two contradictory things at once: shedding the brands they no longer want, with Kraft Heinz announcing then shelving a breakup and Keurig Dr Pepper splitting itself in two, while paying up for the insurgents they cannot build in a lab, from PepsiCo's roughly $2 billion bet on the prebiotic soda Poppi to the $55 billion take-private of Electronic Arts, the deal that erased the line between a game studio and a consumer-media franchise. It is a portfolio being torn apart and reassembled in real time, because management teams have decided that the shape they built for the last decade is the wrong one for the next.
One thread ties the sectors together. The deals clearing today are overwhelmingly either all-cash bids from balance-sheet-rich strategics, all-stock mergers that move no cash and add no debt, or take-privates backed by sovereign and infrastructure equity. The pure leveraged buyout, the engine of the last cycle, is conspicuously rationed.
IV. Private Equity
If M&A is where the rebound shows, private equity is where the strain shows. The asset class is caught in a liquidity trap of its own construction: it bought too high in 2021, it cannot sell at those marks now, and the cuts it was counting on to bail it out never arrived.
The math broke
Buyout value rose 44% in 2025 to about $900 billion, and sponsors now account for roughly a quarter of all M&A. But the underlying model is under real pressure. Entry multiples have climbed to about 14x EBITDA, up from 10x a decade ago, while all-in debt costs run 8% to 9%. Put those together and a fund needs 10% to 12% annual EBITDA growth to clear a 2.5x return, against the 5% that did the job in 2015. Bain's shorthand for the new regime is blunt: "12 is the new 5."
That is why the mega-LBOs that do happen look the way they do. The $55 billion Electronic Arts take-private required a sovereign wealth fund (Saudi Arabia's PIF), a mega-sponsor (Silver Lake), a third equity check (Affinity), and a $20 billion debt package, the largest since the financial crisis, underwritten almost single-handedly by JPMorgan. A consortium of that size assembles only when buyers believe an asset is durable enough to service expensive debt for years. The cost of capital is the deal architecture now.
The exit drought and the distribution crisis
| Indicator | Reading | Context |
|---|---|---|
| Unsold portfolio companies | ~32,000 | Worth about $3.8 trillion |
| Distributions / NAV (DPI) | ~14% | Lowest since the financial crisis; fourth straight weak year |
| Average hold period | ~7 years | Up from 5 to 6 years in 2010 to 2021 |
| Buyout fundraising | ~$395B (-16%) | Weakest since 2017; fund closes down 23% |
| LPs constrained by prior commitments | 53% | Up 15 points in a year |
That table is the private-equity problem in five rows. Roughly 32,000 companies worth about $3.8 trillion are stuck in funds that cannot sell them at acceptable prices, distributions have fallen to about 14% of net asset value, and the feedback loop is vicious: limited partners who do not get cash back cannot commit to new funds, which is why fundraising fell to a 2017 low. By one measure, the 2019-vintage funds have returned only about 22 cents on the dollar five years in. "DPI is the new IRR" has become the industry's mantra for a reason. Paper gains no longer count; only cash does.
Manufacturing the liquidity the market will not give
Unable to sell, sponsors are engineering liquidity through every available channel. The secondaries market hit a record near $240 billion in 2025, up about 50%, split between limited partners selling stakes (around $125 billion) and GP-led deals (around $115 billion). Continuation vehicles, where a sponsor sells a company from one of its funds to another fund it also manages, now account for roughly 15% of all sponsor exits, and about 80% of the largest sponsors have used one. Vista's $5.6 billion continuation vehicle for Cloud Software Group set the template. Alongside that, dividend recapitalizations set a record at $94 billion as sponsors borrowed against portfolio companies to return cash, and NAV lending institutionalized fast, with 17Capital closing the largest-ever dedicated fund at $7.5 billion.
None of it is a real fix, though. Secondaries clear at an average of 87 cents on the dollar, and below 75 cents for older funds, which is the market quietly telling you what those nominally valued assets are actually worth. Continuation vehicles defer price discovery rather than deliver it, and a GP-led deal where the sponsor sits on both sides of the valuation has a conflict that has now reached the Delaware courts. These tools buy time. They do not generate the cash that funds the next vintage, and time, at a 9% cost of capital, is not free.
V. Private Credit
Private credit spent a decade as the asset class that ate the banking system's lunch, growing to roughly $2.3 trillion in assets without a single full cycle to test it. In the first quarter of 2026, the test arrived.
Cracks in the data, a run on the retail channel
The cracks are visible in the data. Fitch put the trailing default rate at a record 5.8% through January, and the leading indicator is worse than the headline: more than half of newly added payment-in-kind features, where a borrower pays interest with more debt instead of cash, are now "bad PIK," added mid-loan because the company cannot service cash interest. Roughly 40% of borrowers in private credit portfolios have negative free cash flow. Because these loans are marked by the lenders themselves rather than by a public market, the stress can stay invisible until it surfaces as a default.
The acute symptom was a run on the retail channel. As redemption requests clustered in March, Apollo formally capped withdrawals on its $25 billion non-traded credit fund, BlackRock's HPS fund restricted them, Morgan Stanley prorated payouts, and Blackstone injected $400 million of firm and employee capital to meet $3.8 billion of requests on its flagship BCRED without gating. The episode exposed the structural mismatch the industry had papered over: illiquid assets funded by vehicles that promised retail investors quarterly liquidity. On May 6 the Financial Stability Board published its first report dedicated to the sector, flagging $220 billion to $500 billion of bank credit lines to private credit funds as the channel through which a shock would reach the regulated banking system. The width of that range, more than two to one, is itself the point: regulators do not yet know the size of the exposure.
The data-center exception
Against all of that sits a real growth story. AI data-center lending has become private credit's new frontier, and the $27 billion Meta and Blue Owl financing for the Hyperion campus in Louisiana, the largest private-credit transaction ever, set the template: investment-grade-rated, long-dated debt secured against hyperscaler infrastructure, with Morgan Stanley projecting some $800 billion of such financing needed through 2028. It is a different animal from the leveraged-buyout lending that is straining, closer to infrastructure finance than to direct lending. The risk is that it rests entirely on hyperscaler capital-spending discipline. If AI revenue disappoints, the residual-value guarantees that make these deals investment grade today become the liability tomorrow.
VI. Venture Capital
Venture capital in 2026 reads as a record and feels like a depression, depending entirely on which company you are. The headline is historic. The distribution is the most concentrated in the asset class's history.
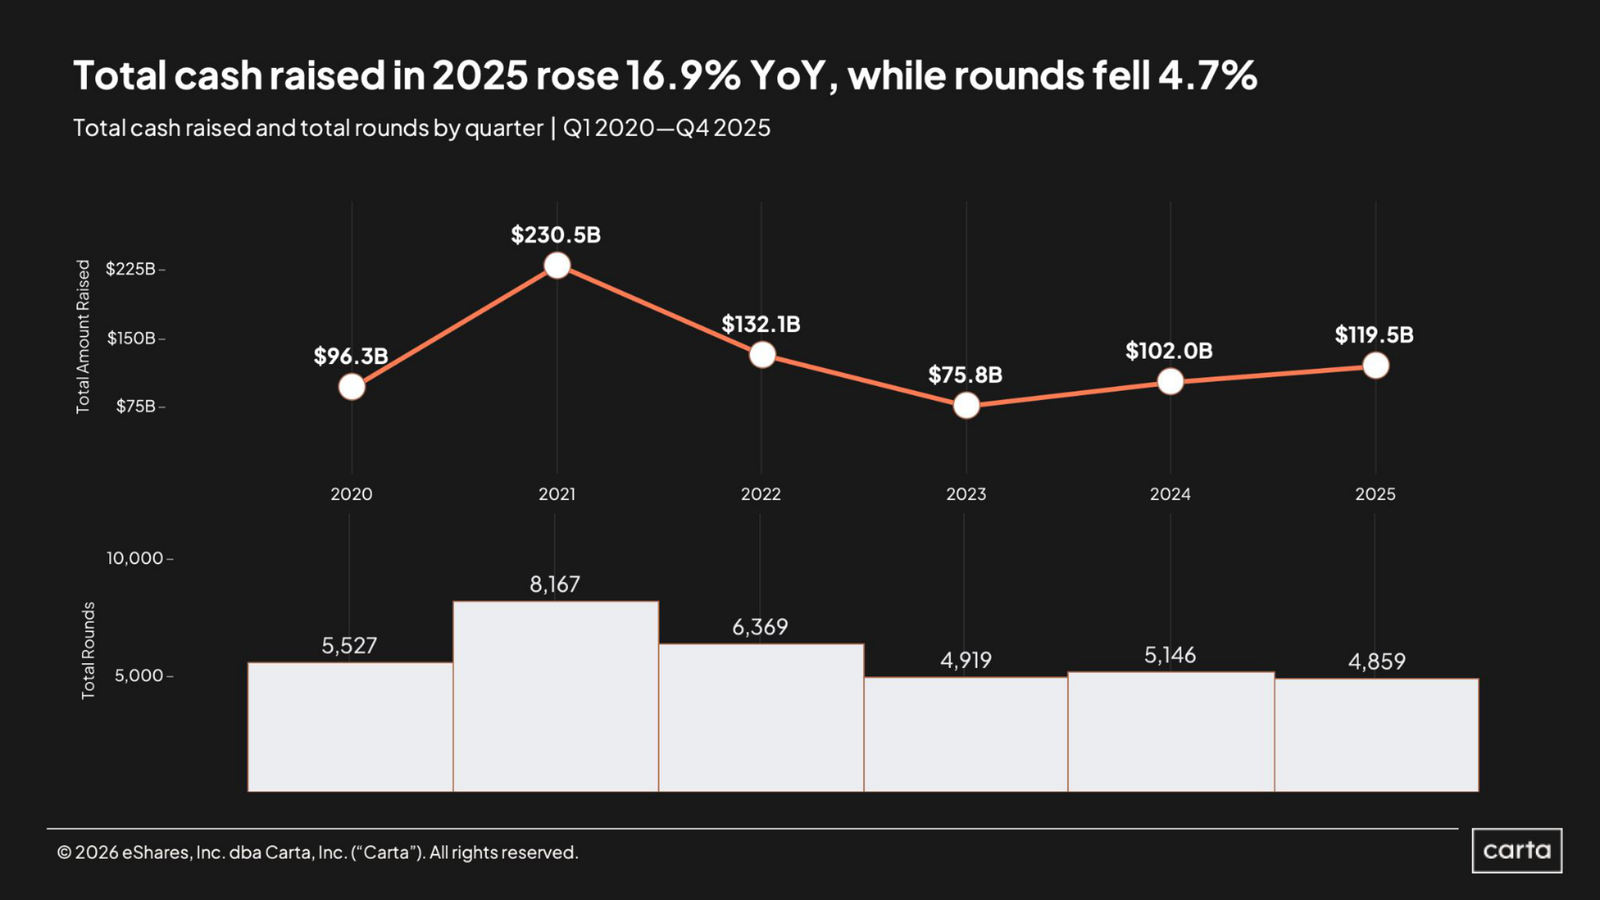
US startups raised $119.5 billion in 2025, up about 17%, even as the number of rounds fell 5%, the same fewer-but-bigger pattern visible across the deal economy. Source: Carta.
A record almost nobody shared
Global venture funding hit a nominal record of $330.9 billion in the first quarter of 2026, more than double the prior quarter. Then read the footnotes. AI took roughly 80% of every venture dollar. Three companies, OpenAI at $122 billion, Anthropic at $30.6 billion, and xAI at $20 billion, were more than half the global quarter by themselves. Strip out the five largest rounds and the total falls by nearly 60%, on a deal count down about 30% year-on-year and the fewest active early-stage non-AI investors in a decade. On Carta's platform, which captures the broad US startup universe, 2025 funding rose 17% to $119.5 billion even as the number of rounds fell, the same fewer-but-bigger signature as the rest of the market.
The AI premium, and the famine underneath it
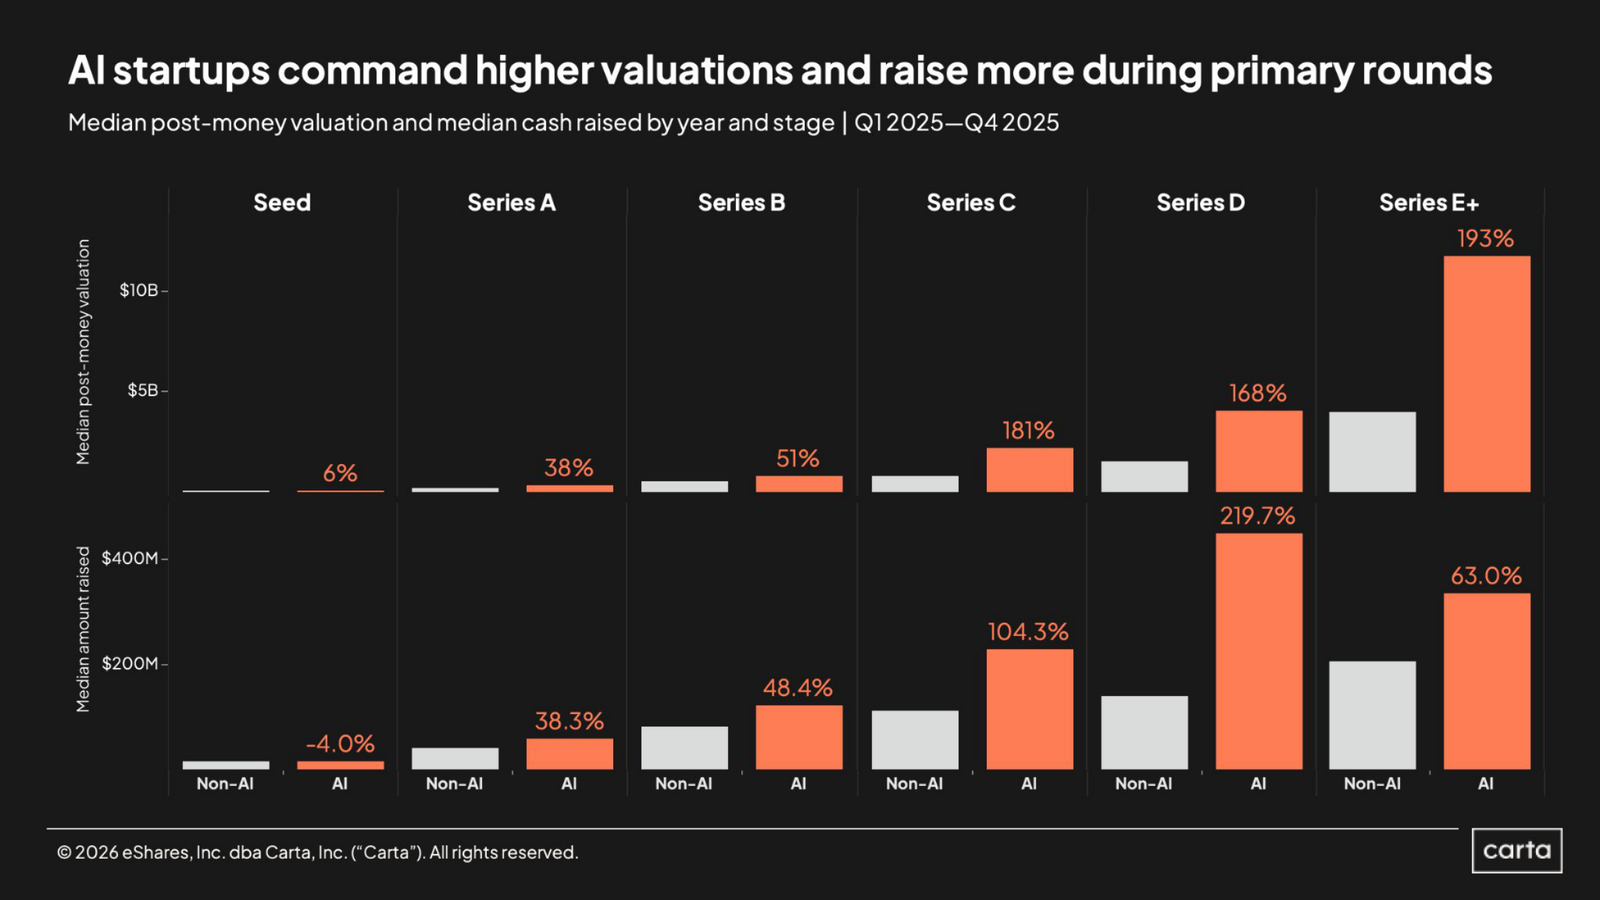
The AI valuation premium is a late-stage phenomenon: roughly noise at seed, but 181% at Series C and 193% at Series E and beyond. Source: Carta.
The premium AI commands is real and it widens as the checks get bigger. Carta's data shows AI companies raising at a 38% valuation premium to non-AI peers at Series A, 181% at Series C, and 193% at Series E and later. The distortion runs deepest exactly where the most capital is deployed, which means a shift in AI sentiment would cascade hardest through the late-stage book, with no public-market price discovery between rounds to cushion it.
For everyone outside AI, the picture is a quiet depression. Adjusted for inflation, non-AI venture in early 2026 fell below where it sat in early 2020. The seed-to-Series-A graduation rate has roughly halved, from about 31% for the 2018 cohort to around 16% recently. First-time fund formation has collapsed 86% from its 2021 peak, the first net decline in the number of active US venture firms since the dot-com bust. And the marks have not caught up to reality: more than 220 former unicorns have quietly lost their billion-dollar status, while companies that last raised in 2021 are carried at valuations a secondary buyer would discount by two-thirds. The record headline is providing cover for a capital drought across most of the portfolio universe.
VII. The Exit Window
Everything upstream, the PE distribution crisis, the venture famine, the secondaries boom, traces back to one closed door: the exit. For three years the IPO window was effectively shut. In 2026 it cracked open, and the next four months will reveal how wide.
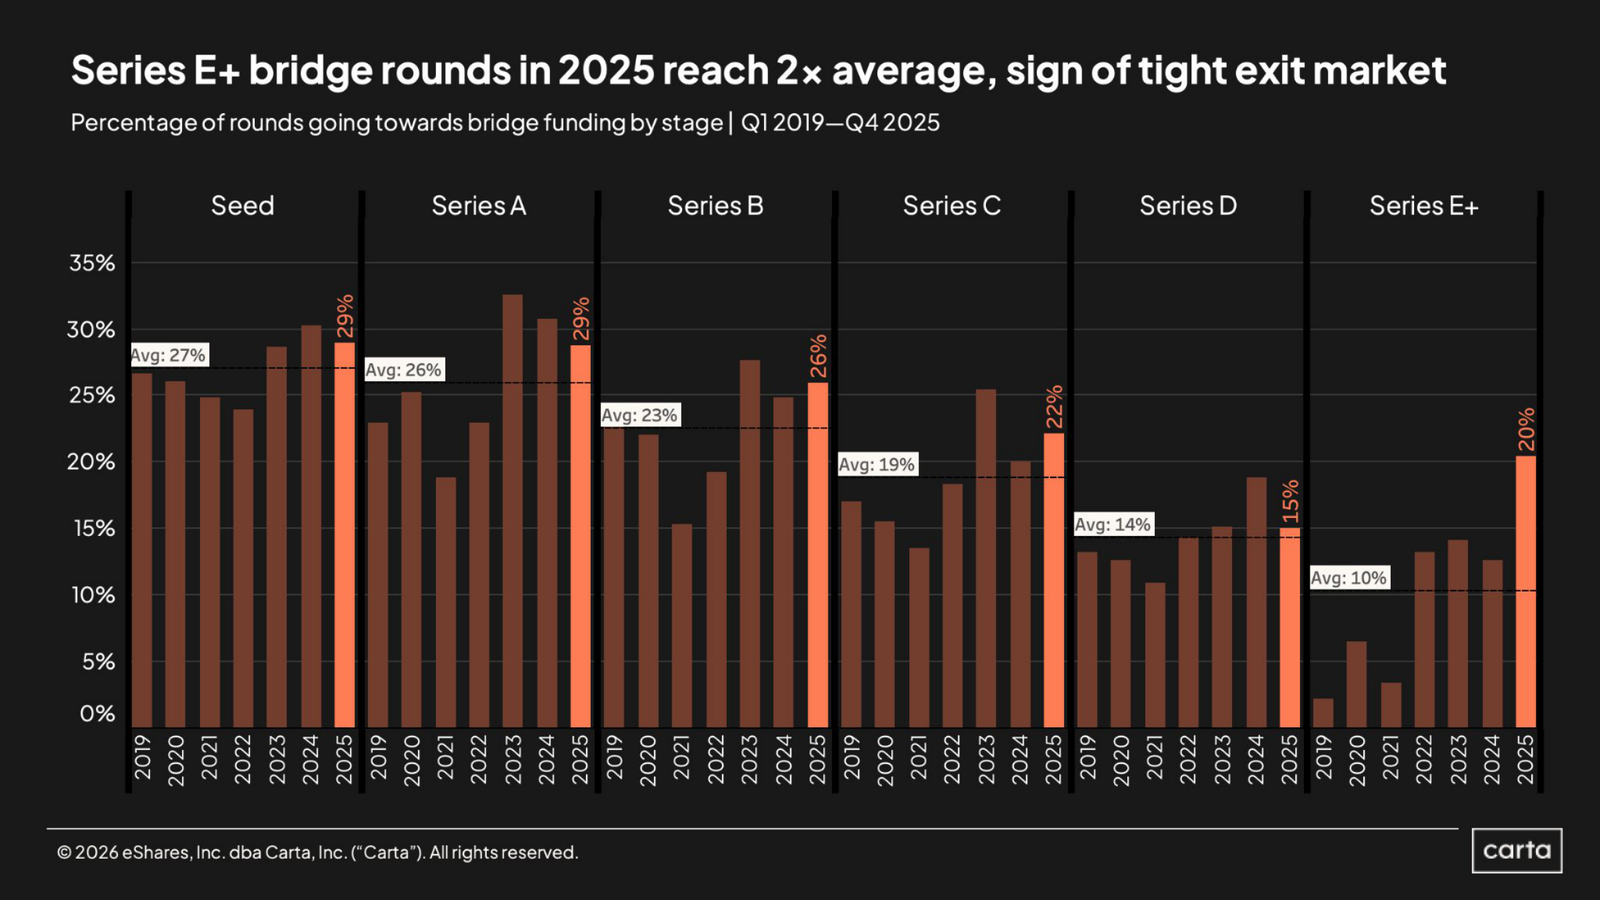
Bridge rounds, financings that keep a company alive without a clean up-round, ran near twice their historical norm at the latest stages in 2025, the clearest signal that the exit market is still backed up. Source: Carta.
The megacycle nobody has seen before
The autumn calendar is unlike any prior IPO season. SpaceX is set to price near June 11 at roughly $1.77 trillion, raising up to $75 billion, which would be the largest IPO in history by a wide margin. Anthropic filed a confidential S-1 on June 1 targeting October, fresh off a $65 billion round at a $965 billion valuation on a $47 billion revenue run-rate. OpenAI filed in May targeting September. If all three price, they would introduce something close to $3 trillion of market value to public investors in a compressed window.
| Company | Target | Last private valuation | Revenue run-rate | Status |
|---|---|---|---|---|
| SpaceX | ~June 11, 2026 | ~$1.0T (post-xAI) | n/a | Pricing; ~$1.77T target |
| OpenAI | September 2026 | $852B (March round) | ~$25B+ | Confidential S-1 filed |
| Anthropic | October 2026 | $965B (May round) | ~$47B | Confidential S-1 filed |
| Databricks | H2 2026 (expected) | $134B (December) | ~$5.4B | No S-1 yet |
| Stripe | No near-term IPO | $159B (tender) | n/a | Staying private |
The 2025 class showed why these are not foregone conclusions. The pattern was a violent first-day pop followed by a long bleed: Figma surged 250% on debut and then fell about a third below its offer price, Klarna dropped roughly 30%, Chime about 25%. Only the names with contracted, structural revenue stories held, CoreWeave up sharply on its data-center backlog, Circle on the stablecoin narrative. The window is selectively open for AI and infrastructure plays with real revenue, and effectively shut for consumer and software businesses whose valuations depend on the cheap-money discount that disappeared.
Secondaries became the new IPO
While the public window stayed mostly closed, the private market built its own exit. In the twelve months to mid-2025, venture secondary transactions ($61.1 billion) surpassed venture-backed IPO proceeds ($58.8 billion) for the first time ever. Tender offers on Carta rose 62% to nearly 400. For the vast majority of the private equity overhang, the realistic path to liquidity is not a listing at all but a secondary sale, a continuation vehicle, or a strategic acquirer, which is why M&A has quietly become the dominant venture exit. The mega-IPOs will grab the headlines. The plumbing of the exit market has already been rerouted around them.
VIII. Cross-Border, Sovereign Capital & Regulation
The map of who buys, from where, and with whose permission is being redrawn in real time. Three forces are doing the redrawing: the gravitational pull of the United States, the arrival of sovereign wealth as a principal acquirer, and a regulatory regime that has loosened on antitrust while hardening on national security.
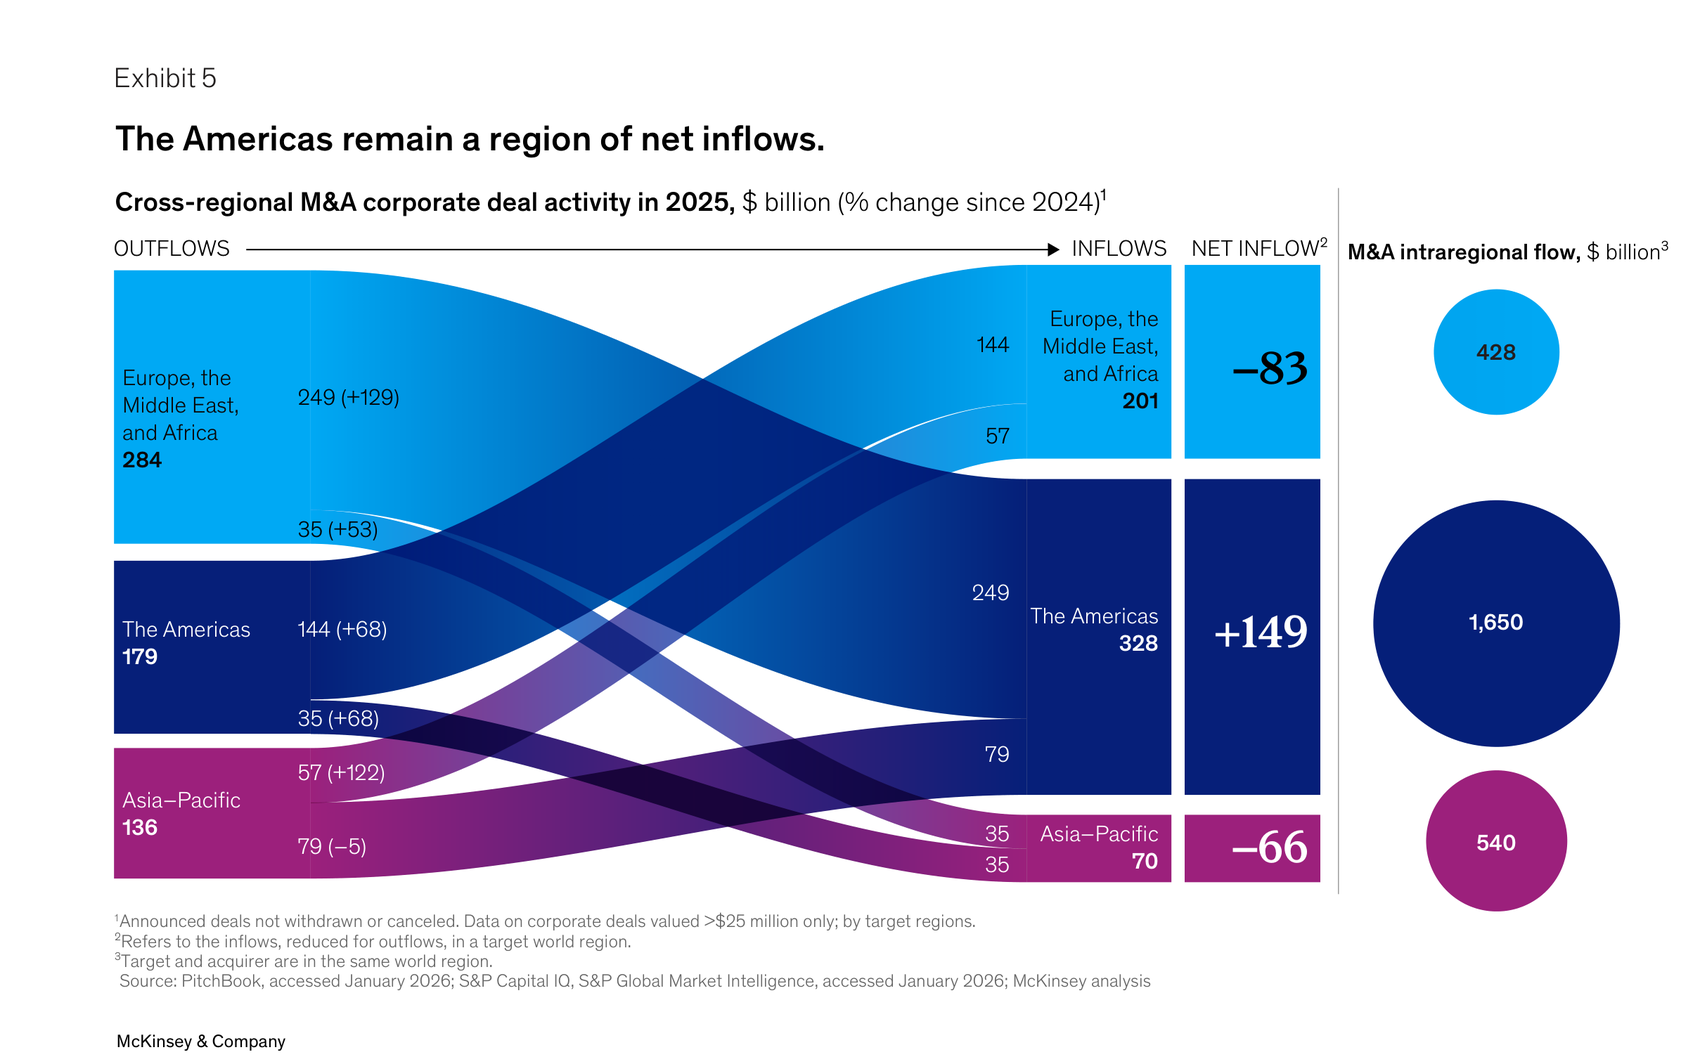
The Americas were the world's only net-inflow region for cross-border M&A in 2025, drawing a net $149 billion as European and Asian acquirers bought US assets. Source: McKinsey & Company.
Capital flows toward America, and toward the Gulf's checkbook
The Americas were the only net-inflow region for cross-border M&A in 2025, drawing a net $149 billion as European acquirers more than doubled their US investments. Tariff anxiety, counterintuitively, accelerated the flow, as foreign buyers rushed to own US assets before trade barriers hardened. Japan emerged as the world's third-largest M&A market, its value roughly doubling on a wave of governance reform, take-privates, and the first successful hostile takeover of a listed Japanese company by a foreign buyer in memory. China moved the other way, its outbound deal count falling to a near-decade low as Beijing's new July 1 rules let the State Council block, reverse, and penalize overseas deals, and as it blocked Meta's attempt to buy a Singapore-incorporated AI startup founded by Chinese engineers.
The single biggest change in who writes the checks is sovereign wealth. Gulf and Asian funds backed roughly $146 billion of deals in 2025, nearly triple the prior year, and they are no longer passive limited partners. PIF led and majority-owns the Electronic Arts consortium; Abu Dhabi's MGX and Singapore's GIC and Temasek anchored Anthropic's mega-rounds and the $40 billion Aligned Data Centers deal. Nine of the ten largest sovereign deals of 2025 were co-investments alongside private equity sponsors. With patient, oil-funded capital and no need for cheap debt, sovereign funds are structurally advantaged in exactly the higher-for-longer environment that hobbles leveraged buyers. The one caution sits inside the boom: after the Hormuz shock, PIF cut its target international allocation from 30% to 20%, redirecting capital toward domestic spending. The Gulf is flush, but it is also looking closer to home.
A friendlier antitrust regime, a harder security screen
The regulatory backdrop turned decisively more permissive on competition. US agencies filed zero contested merger complaints in the first quarter, settling deals with structural divestitures instead, and the average investigation time fell. The most consequential ruling of the year was not an antitrust action at all but the Supreme Court's 6-3 decision striking down the IEEPA tariffs, which cut the average US tariff rate roughly in half overnight before the administration rebuilt it under other authorities. But what opened on competition tightened on national security: CFIUS now runs two tracks, fast-lane clearance for allied investors and aggressive scrutiny of Chinese buyers in chips, AI, and critical minerals. For cross-border dealmakers, the question is no longer mainly "is it anticompetitive." It is "who owns the buyer, and where."
IX. What We Are Watching
Strip away the eight sections and one shape remains. A deal economy that staged a genuine, broad-based rebound in 2025 is now running on assumptions that have quietly expired. Marks have barely moved. Secondaries still clear near ninety cents. Consensus still pencils another record year. All of it was underwritten for a Fed that was supposed to be cutting by now and is instead debating whether to hike.
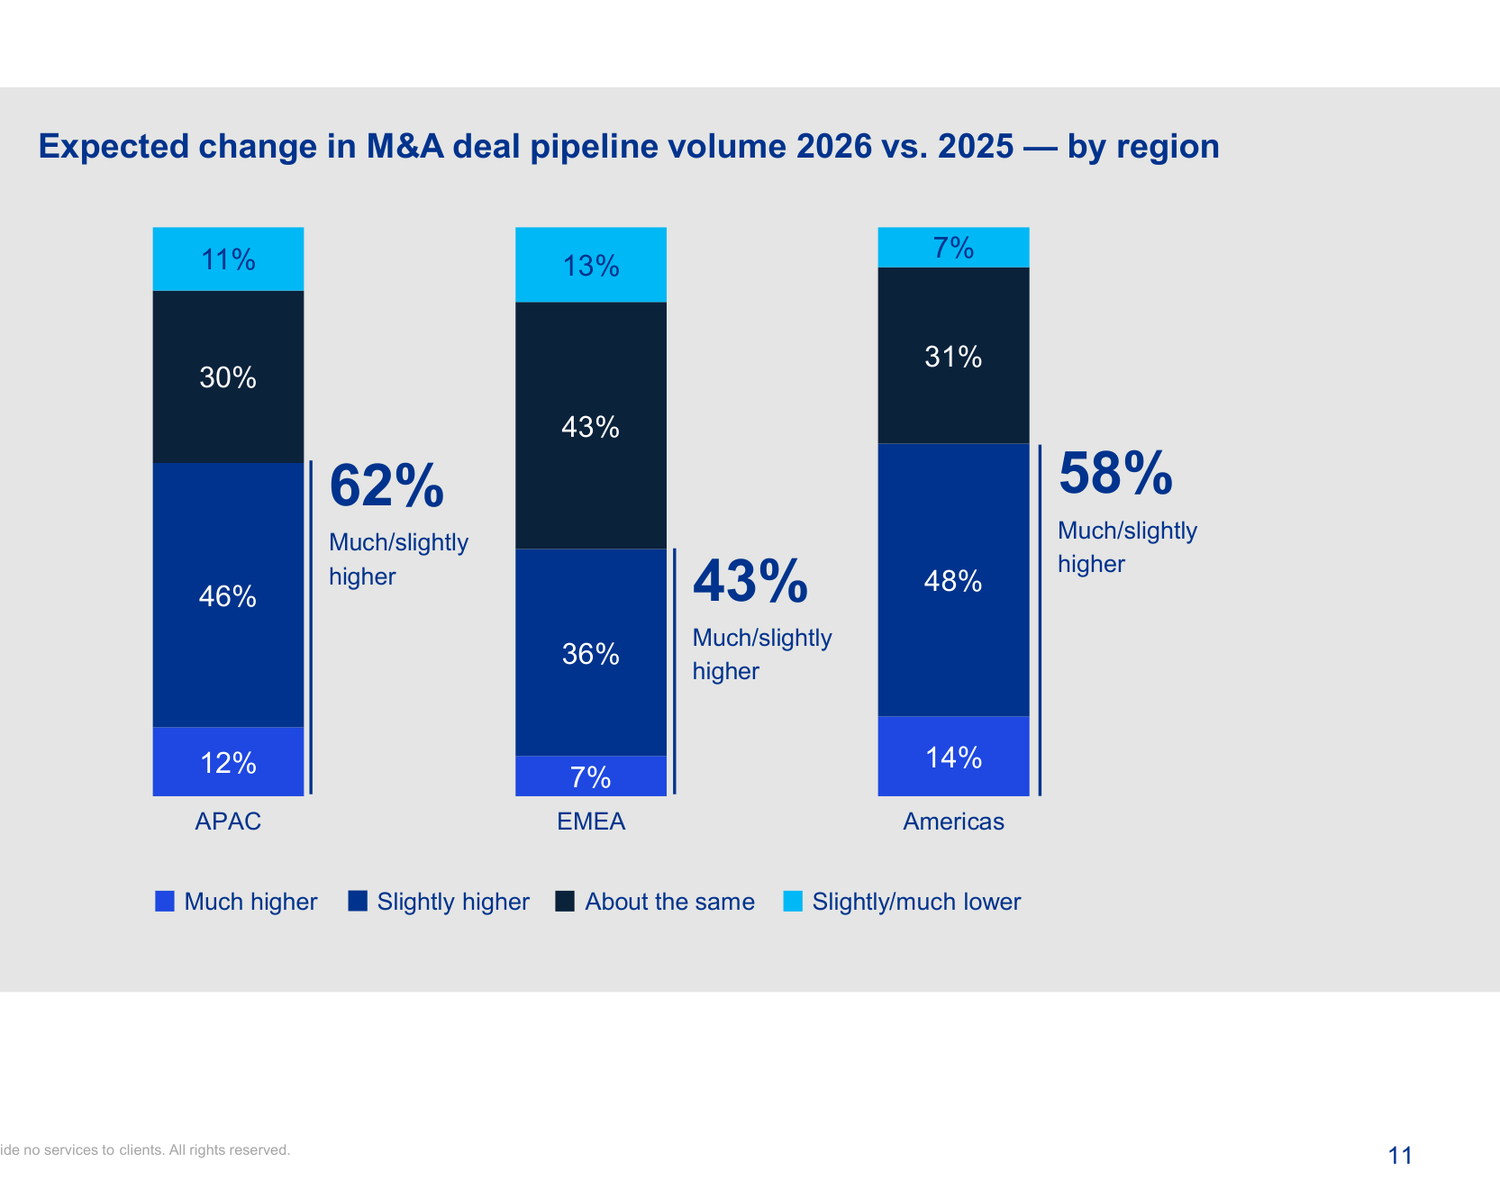
Dealmaker optimism is real: 62% in the Americas, 58% in APAC, and 43% in EMEA expect higher deal volume in 2026. The question is whether the financing cooperates. Source: KPMG.
The next four months force the question into the open. Kevin Warsh chairs his first Fed meeting on June 17, where a hawkish signal would reprice every LBO model and DCF in real time. SpaceX prices around June 11, and OpenAI and Anthropic target September and October, three order books that will tell us whether public investors will ratify trillion-dollar private marks or reset them. And behind those headline events sits the slower, more important question: whether the vast overhang of unsold private equity, financed on cheap money, can find its way to an exit before the cost of carrying it compounds further.
Our posture into the back half of the year is easy to state and uncomfortable to hold. The strategic case for dealmaking is the strongest it has been in years, and we expect the megadeal pace to continue, because the companies doing those deals are not waiting on rates. But we would favor the acquirers who do not need cheap debt, sovereign funds, balance-sheet-rich strategics, all-stock mergers, over the leveraged buyers still hoping for relief. We would treat the autumn IPO calendar as a sequence of coin flips, not a foregone reopening. And we would watch the secondaries market and the private-credit default rate more closely than the headline deal totals, because that is where the strain of an unfinished repricing will show first. The rebound was real. Whether it was a beginning or a top is a question the market spent 2025 not asking, and will spend the rest of 2026 unable to avoid.
How we put this together
This is our first dedicated state of M&A and private markets, a companion to the June 2026 public-markets outlook we publish alongside it. The figures run through early June 2026 and draw on the major 2026 dealmaking reports from Bain, McKinsey, KPMG, and Carta, on company filings and exchange disclosures, on the venture and private-equity data we track week to week, and on the deal and financing markets we watch day to day. Where the consensus outlooks assumed a falling cost of capital that has not materialized, we say so, because that assumption is the one most likely to be tested before the year is out. Forecasts, valuations, and price targets are the relevant institutions' own.
Anwaar Malik
This research is powered by AllMind. This analysis was synthesized using our deep research engine, which processes institutional research, central-bank communications, earnings transcripts, filings, and macroeconomic data to surface actionable investment insight. See it in action.
Disclaimer
This report is provided for informational purposes only and does not constitute investment advice, an offer to sell, or a solicitation of an offer to buy any securities. The views expressed represent the author's opinions as of the publication date and are subject to change without notice.
Past performance is not indicative of future results. All investments involve risk, including possible loss of principal. The information contained herein has been obtained from sources believed to be reliable, but accuracy cannot be guaranteed.
This analysis may contain forward-looking statements that involve risks and uncertainties. Actual results may differ materially from those projected. Readers should conduct their own due diligence and consult with qualified financial advisors before making investment decisions.
AllMind and the author may hold positions in securities mentioned in this report.