
Inside AllMind's Petabyte-Scale Financial Data Pipeline
How we built the infrastructure behind AllMind: exchange-level market data via Databento, 3,000+ web crawlers, a petabyte-scale data lakehouse on Iceberg and BigQuery, and proprietary Mixture-of-Experts AI models serving 25+ institutional investment teams.

Published February 14, 2026
In this article
Every month, AllMind ingests, processes, and serves over 30PB of financial data. Exchange-level orderbook data, hundreds of millions of documents, broker research, ESG filings, alternative data. All of it flowing through a system we built from scratch to power AI-driven research terminals for institutional investors.
This is the technical breakdown of how that system actually works. Not the marketing version. The real architecture, the real tradeoffs, and the real reasons we made the decisions we did.
We built this because we had to. The quality of every AI-generated research answer is bounded entirely by the quality of the data underneath it. Get the pipeline wrong, and nothing downstream matters.
Why We Built Our Own Pipeline (And Where We Didn't)
Let's be clear about something upfront: we work with some of the best data vendors in the industry. S&P Global and Capital IQ for market, index, industry, pension, estimates and transcript data. LSEG for I/B/E/S estimates, analyst revisions, credit and M&A data. FactSet for fundamentals, SEC and SEDAR filings, and Revere supply-chain relationships. MSCI for ESG. The major brokers for sell-side research. These are world-class data providers, and we're not trying to replace them.
AllMind licenses 6,800+ premium data sources from 100+ providers and partners. Together with the company's own ingestion, those relationships feed a current estate of 750M+ documents. The platform is therefore both a data system and an AI research system: licensed and structured sources are already present before a customer connects its own documents or warehouse.
What we did replace is the conventional approach to everything else: the pre-packaged, one-size-fits-all aggregation layer that most platforms rely on to tie it all together. You sign a high six-figure (most often seven-figure) contract, plug into an aggregator's API, and get data that someone else decided was important, delivered on someone else's schedule.
We tried that. Two problems killed it immediately.
First, the data arrives pre-filtered. The aggregator already decided what matters and what doesn't. For an analyst covering 30 companies across multiple jurisdictions, that means blind spots baked into the foundation before you've even asked a question.
Second, latency compounds at every intermediary. By the time a research insight reaches an analyst's screen through a chain of vendor to aggregator to platform to interface, the information advantage has evaporated. In markets that move in minutes, getting data hours late is useless. Especially when it comes to alternative data, this means we could be receiving information that is anywhere from one to three quarters delayed. We had to find a more optimized solution.
Our thesis was simple: partner with the best-in-class vendors for structured data where they genuinely have an edge (fundamentals, filings, estimates, index and industry data, supply-chain relationships, ESG ratings), but build and control the pipeline for everything else. Market data ingestion, document crawling, alternative data processing, AI retrieval. End to end. That thesis led us to build six distinct infrastructure layers, each reflecting a deliberate architectural choice, and in several cases, a deliberate rejection of whatever the "default" cloud-native option was.
Market Data: Databento + QuestDB on Kubernetes
We ingest hundreds of terabytes of market data directly from exchanges every month through Databento, then store and process trillions of rows in QuestDB clusters running on Kubernetes.
Why Databento? Because every other option in this space is built for a different era. Traditional market data feeds from providers like Bloomberg mean enterprise contracts, weeks of onboarding, and integration against vendor-specific delivery infrastructure. Databento gives you exchange-level data through a developer-first API, sourced directly from exchange matching engine feeds. Their infrastructure uses FPGA-based capture with nanosecond-precision timestamps, achieving median normalization latency of about 6 microseconds. Their open-source DBN format normalizes protocols across CME MDP 3.0, Nasdaq ITCH, NYSE Pillar, and others into a single message format, which means adding a new exchange to our pipeline requires zero parser changes on our end. Zero!
Once data arrives, it goes into QuestDB, an open-source time-series database purpose-built for financial workloads. It can ingest up to 11.4 million rows per second at high cardinality. Its columnar storage engine scans billions of rows in milliseconds. Three features made it non-negotiable for us:
- ASOF JOIN: lets us temporally align tick data across different instruments and venues without expensive window functions. When you're correlating trades across fragmented markets, this isn't a nice-to-have. It's load-bearing.
- SAMPLE BY: enables fixed-interval resampling for OHLCV aggregation directly in the query layer. No ETL step, no intermediate tables.
- Nanosecond timestamps: options tick data regularly has multiple events within the same microsecond. If your database rounds to milliseconds, you're losing data.
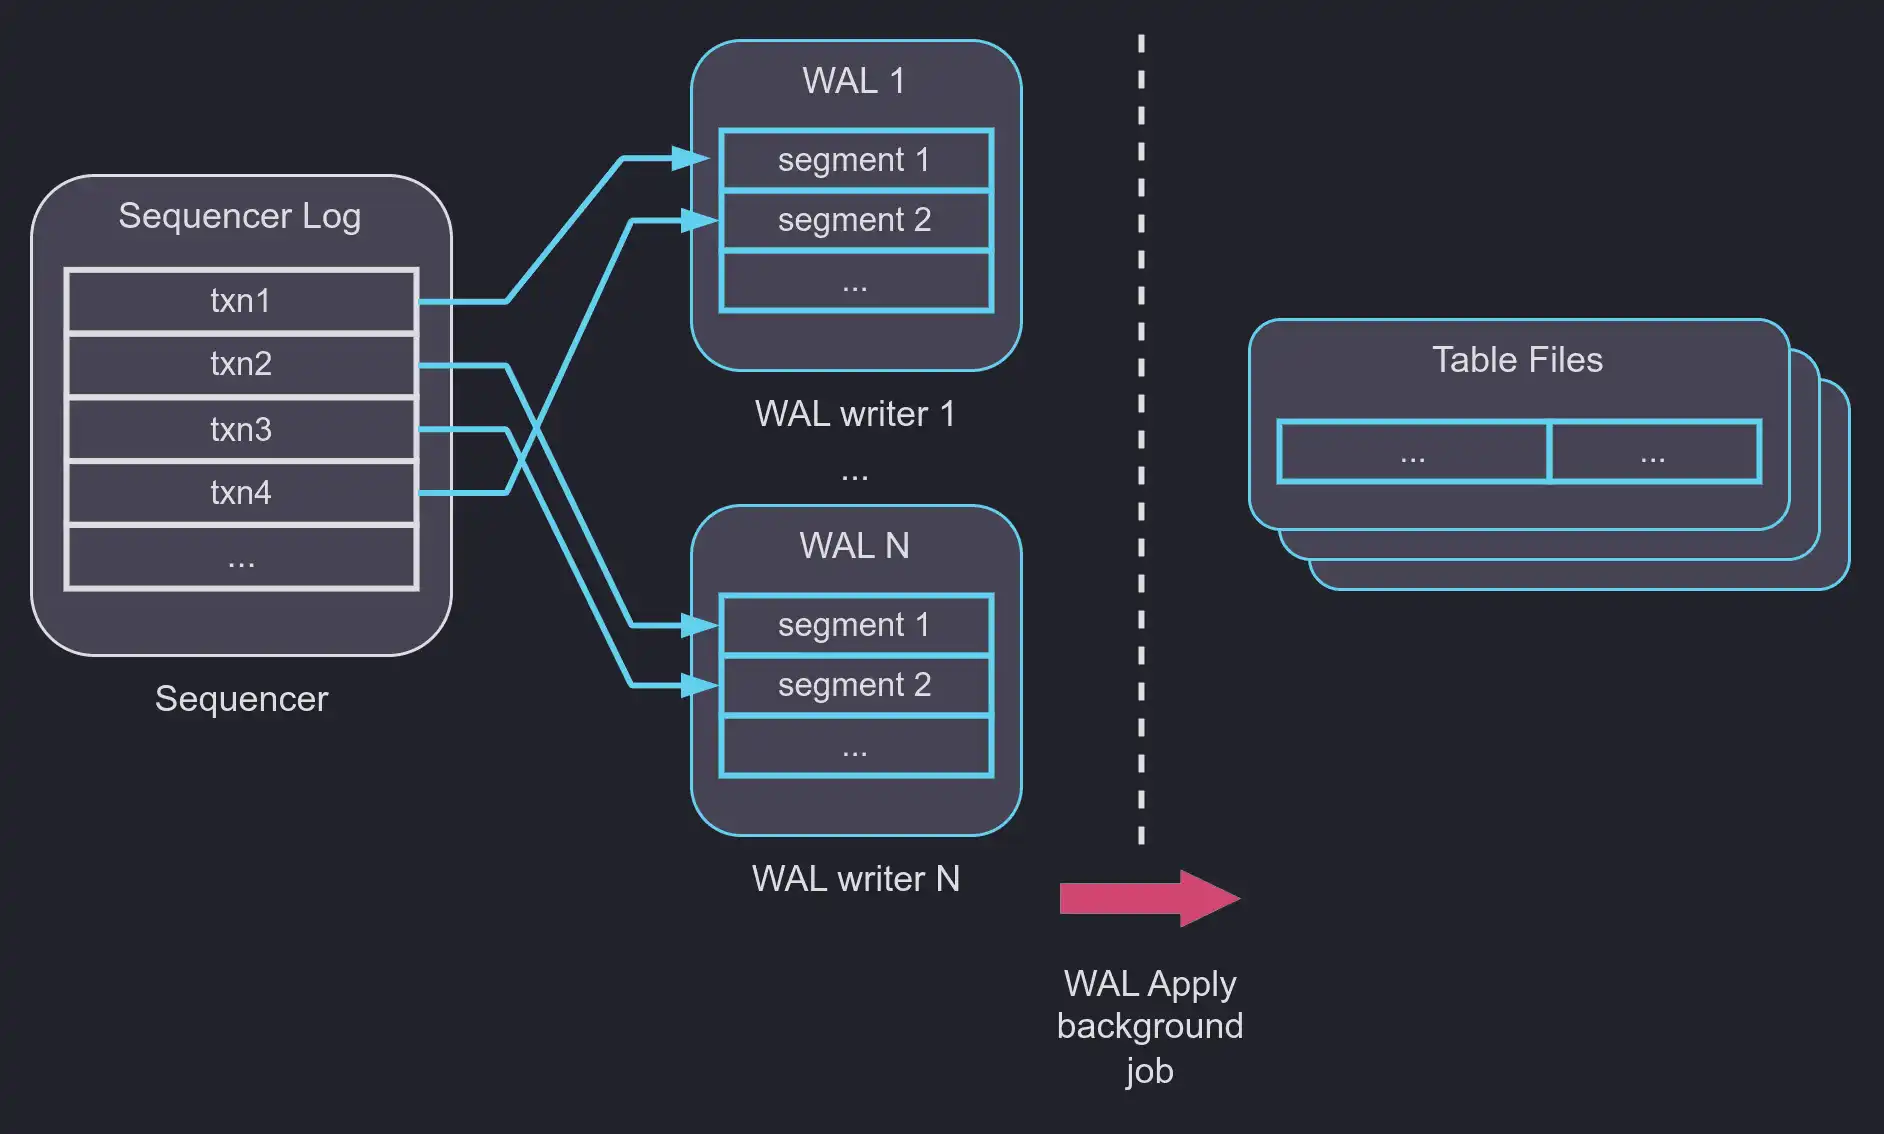
We run QuestDB on Kubernetes with tiered storage: hot data lives in QuestDB's native columnar format for sub-millisecond queries, while cold historical data automatically tiers to Apache Parquet on object storage. One SQL interface queries both. This lets us maintain months of tick-level data in real time without paying to keep everything in hot storage.
The output feeds two things: our internal market index monitoring platform (custom baskets, cross-asset correlations, real-time signals) and the clean price data analytics layer in the analyst-facing research terminal.
3,000+ Web Crawlers Running Continuously
Financial web crawling is a fundamentally different problem from general-purpose web indexing, and we learned that the hard way.
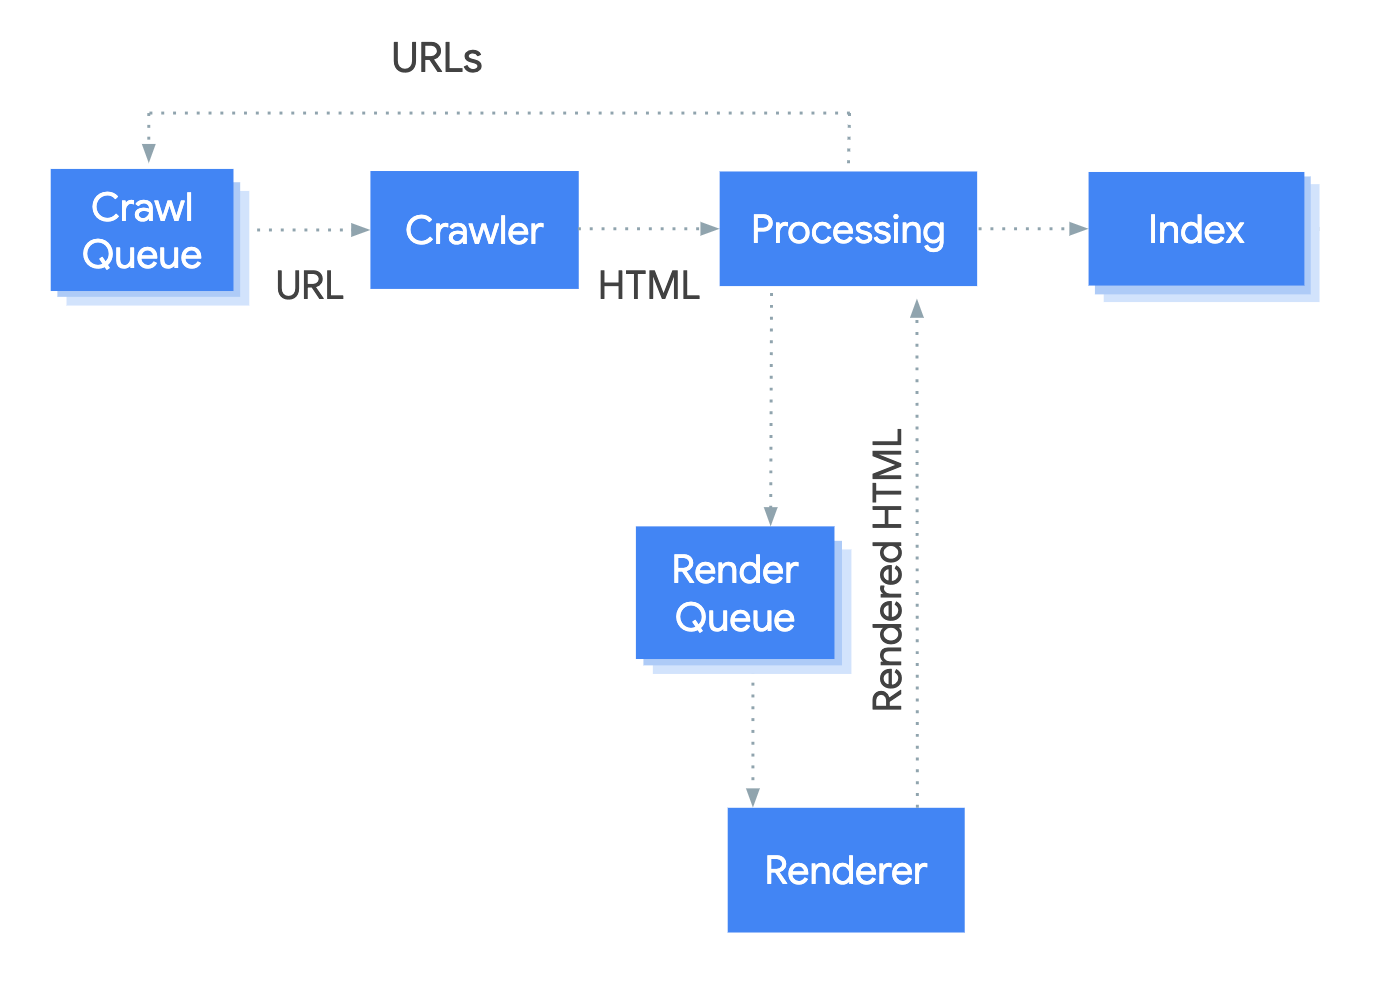
The vast majority of institutional-grade financial content (SEDAR+ filings, central bank publications, corporate investor relations pages) is rendered client-side via JavaScript frameworks. A traditional HTTP-based crawler hits these pages and sees an empty shell. Nothing. No content. The actual data loads after JavaScript executes, dynamic elements render, and API calls resolve.
So we built our own crawling framework. Over 3,000 concurrent crawlers using a proprietary JavaScript-rendered approach, conceptually similar to how Googlebot processes JavaScript-heavy pages. Each crawler instance fully renders the target page, executes JavaScript, waits for dynamic content to load, and then extracts structured content from the rendered DOM.
We maintain a curated domain knowledge base: a carefully managed list of 7,500+ financial data sources ranked by institutional relevance, update frequency, and data quality. Each domain has a custom extraction profile. Which elements to capture, how to handle pagination, what counts as a meaningful content update versus a cosmetic CSS change. This prevents our crawlers from wasting cycles on trivial updates while ensuring we capture every material filing or disclosure within minutes of publication.
There's another layer to this that most people don't think about: a huge number of financial data sources actively block traditional crawling. Rate limiting, IP-based blocking, CAPTCHAs, bot detection. These are real obstacles when you're hitting thousands of domains at scale. We run our crawlers through rotating proxy infrastructure with residential and datacenter IP pools, managed fingerprinting, and request throttling calibrated per domain. Without this, half our crawler fleet would be blocked within hours. It's unglamorous plumbing, but it's the difference between a crawling system that works in a demo and one that works in production 24/7. Our proxy infrastructure alone took months to architect and harden at this scale.
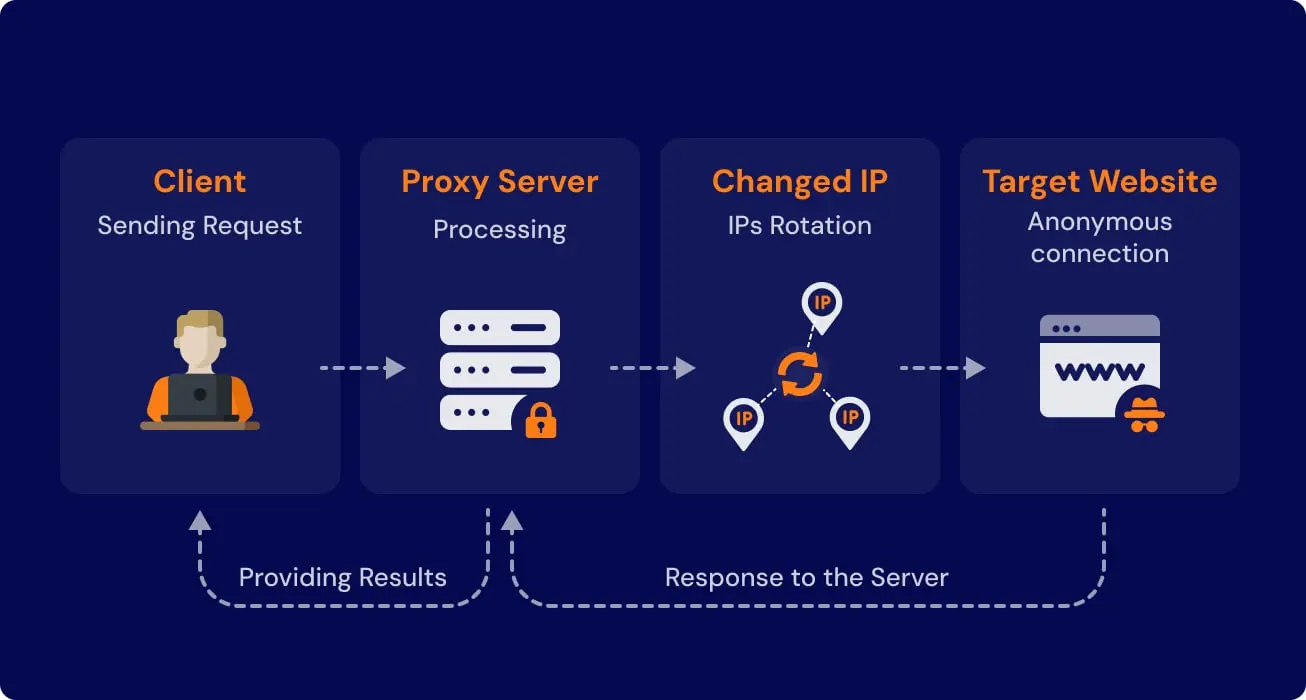
Why 3,000+? Because financial data is spread across thousands of sources globally. Exchange websites, regulatory portals, central banks, corporate IR pages, ESG rating agencies, patent databases, court filing systems. Each has its own structure, update cadence, rendering behavior, and anti-bot posture. Scaling to this breadth while maintaining extraction quality requires horizontal crawler capacity, deep per-domain configuration, and robust proxy management. You can't just point a scraper at the internet and hope for the best.
The Data Lakehouse: Petabyte-Scale Storage and Query
This is where raw ingested data becomes something you can actually query, join, and feed into AI models. We run a hybrid data lakehouse combining Google Cloud Storage, BigQuery, Apache Iceberg, and Bigtable. Each one handles a specific access pattern.
Apache Iceberg sits at the core as our open table format. Originally developed at Netflix, now backed by AWS, Google, Snowflake, and Databricks. It's become the dominant open table format for good reason. For financial data specifically, three capabilities matter:
- Time travel: we can query any historical version of a dataset. This isn't optional. Regulators and auditors need to reconstruct exactly what data was available at a specific point in time. Without time travel, you're maintaining separate snapshot tables and hoping nothing falls through the cracks.
- Partition evolution: lets us change how data is partitioned without rewriting existing files. Our query patterns evolve constantly. Rewriting petabytes of data every time we want to optimize partitioning isn't realistic.
- Nanosecond timestamps: the V3 specification finally added this. Financial time-series data with sub-microsecond precision is now a first-class citizen in Iceberg.
BigQuery serves as the primary analytical query engine for ad-hoc research and complex joins. Its serverless architecture decouples storage from compute, so we can run massive analytical queries across petabytes without provisioning cluster capacity. We use it heavily for cross-referencing. Correlating the timing and content of insider transaction filings against subsequent price movements in our QuestDB tick data, for example.
Redis serves as our in-memory caching layer. When an analyst runs a query that hits the same underlying data multiple times, or when multiple analysts are researching the same company simultaneously, Redis keeps frequently accessed results in RAM so we're not re-querying BigQuery or Bigtable on every request. For a research terminal where responsiveness directly affects user trust, the difference between a 200ms cached response and a 2-second cold query is everything.
Bigtable is honestly the backbone of the whole system. It handles high-throughput, low-latency key-value lookups: entity resolution, metadata retrieval, the serving layer behind autocomplete and entity linking in the research terminal. When an analyst types a company name, the system resolves it to a canonical entity and retrieves associated metadata (tickers, filing history, related entities) in single-digit milliseconds. Bigtable's consistent sub-10ms latency at any scale makes it the right choice for this specific pattern.
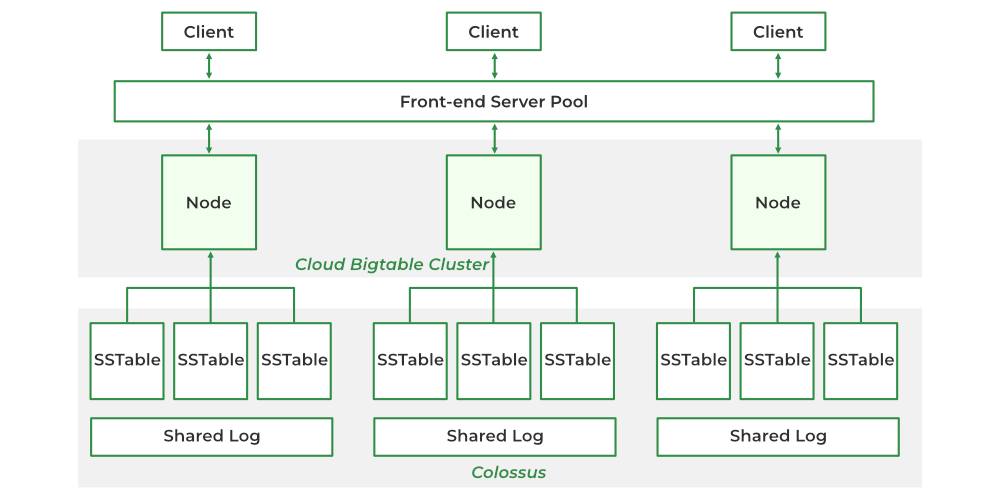
What makes Bigtable special for us is its rowkey architecture. We design composite rowkeys that let us do precise, millisecond lookups across petabytes of data without scanning. It's a solution that very few teams in the Google Cloud ecosystem actually use at this scale, but for our access patterns it's been a hidden gem. Most people default to BigQuery for everything or try to force Firestore into use cases it wasn't built for. Bigtable sits in this sweet spot of massive scale, predictable latency, and cost efficiency that's hard to replicate with anything else.
The ETL orchestration layer connects everything: data transformations, quality checks, deduplication, routing. Raw crawled documents flow through extraction pipelines, get enriched with entity tags and metadata, and land in Iceberg tables partitioned by source type and date. Market data flows from QuestDB's hot tier into Iceberg for long-term analytical access. The result is a unified platform where any query can join across document content, market data, and entity metadata.
AI: Frontier Models + Proprietary Mixture-of-Experts
Here's the thing about using frontier LLMs for financial research: they're not good enough on their own. Not even close.
Out-of-the-box frontier models achieve roughly 19% accuracy on standardized financial benchmarks. Build a well-designed RAG system on top? You get to about 56%. Better, but nowhere near what institutional investors need when they're making decisions backed by real capital.
The gap exists because financial questions require domain-specific reasoning that general-purpose models don't have. "Diluted EPS" and "basic EPS" are different metrics. A "material weakness" in an audit report has specific regulatory implications. Canadian IFRS reporting conventions differ from US GAAP in ways that directly affect comparable analysis. A general-purpose model trained on the internet doesn't understand these distinctions reliably.
So we built a hybrid architecture. Frontier models like Anthropic's Claude and Google's Gemini handle what they're good at: natural language understanding, complex reasoning chains, output generation. Our proprietary Mixture-of-Experts (MoE) models, built on open-source foundations like Google Gemma, handle precision: retrieving the exact right data from our petabyte-scale corpus and interpreting it with domain accuracy.
The MoE architecture splits computation into specialized "expert" subnetworks. A learned router selects which experts to activate for each input. A model with billions of total parameters might activate only a fraction per inference, keeping latency low while maintaining the full model's knowledge capacity. Mixtral 8x7B, for reference, has 46.7 billion total parameters but activates only about 12 billion per forward pass.
We apply this with a finance-specific twist. Individual experts specialize in distinct financial domains:
- Equity research and earnings analysis
- Fixed-income and credit
- ESG and sustainability data
- Regulatory filings
- Macroeconomic indicators
- Alternative data interpretation
The router learns to activate the right combination based on the analyst's query. Ask about a company's debt covenants, and the credit and regulatory filing experts engage. Ask about supply chain ESG risks, and the ESG and alternative data experts fire. The system is routing to domain expertise, not trying to be a generalist.
The combination delivers retrieval quality that neither approach achieves alone. Frontier models for generalization, MoE models for financial precision.
Terabytes of RAM on Kubernetes, Across AWS and Google Cloud
Running all of this creates a compute profile that is both massive and wildly variable. Market data ingestion peaks during trading hours and drops to near zero on weekends. Crawling workloads spike when regulatory filing deadlines hit. AI inference load follows analyst working patterns. Fixed-capacity infrastructure would either waste money during quiet periods or fall over during peaks.
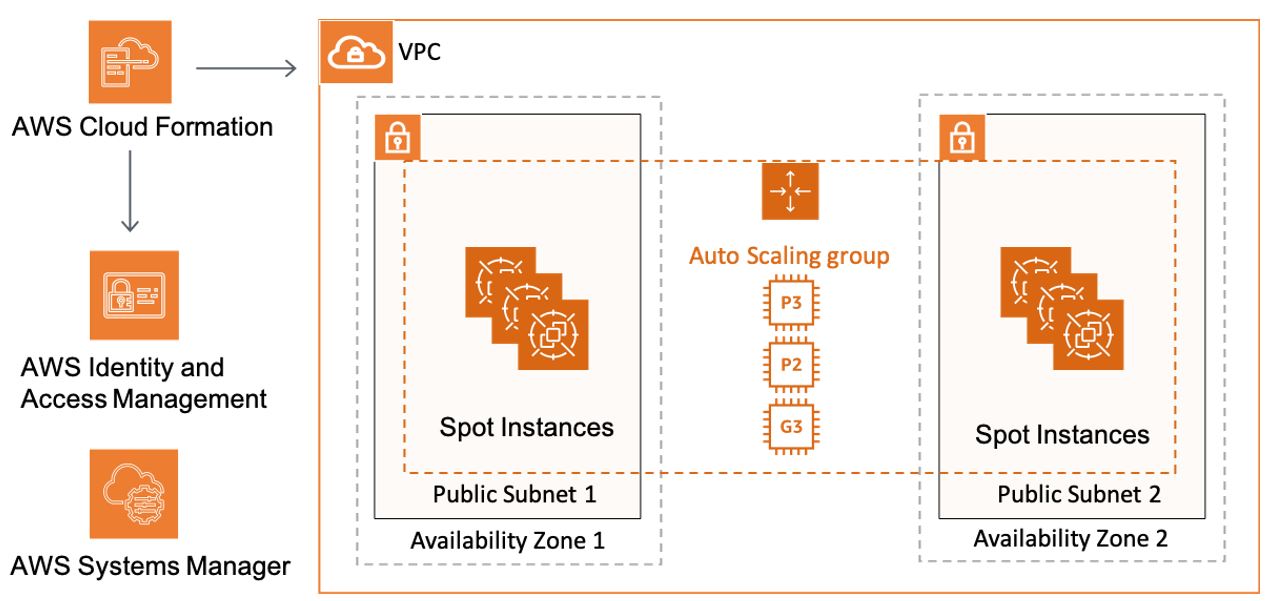
We run Kubernetes clusters provisioning terabytes of RAM monthly across a combination of AWS EC2 and Google Cloud VM instances. QuestDB instances, crawler fleets, ETL pipelines, AI inference servers, and serving infrastructure all run as separate workload classes with independent scaling policies. Kubernetes handles the autoscaling declaratively, and it's gotten substantially easier with tools like GKE Autopilot, AWS EKS Auto Mode, and the advancements in projects like Karpenter. Back in 2018, this would have been a nightmare. You define resource requirements, and K8s scales pod counts based on actual demand.
The Spot instance strategy is where the real cost optimization happens. AWS and Google Spot VMs offer 60-90% discounts versus on-demand pricing, but they can be reclaimed with minimal notice. We architect every processing workload to be checkpointable and resumable. If a Spot instance running a crawling batch gets reclaimed, work-in-progress checkpoints to durable storage and another instance picks it up. For market data ingestion, which cannot tolerate interruption, we use on-demand or reserved instances. For batch processing, ETL, and non-latency-sensitive AI inference, we run almost entirely on Spot.
The multi-cloud setup across AWS and Google Cloud is also a deliberate availability decision. Financial infrastructure cannot afford single-provider dependency. Our Kubernetes clusters span both clouds with workloads that can failover between them. Data replicates across providers, and the orchestration layer treats both as a unified resource pool.
Proprietary PDF Processing and Multilingual OCR
This is the last mile of our pipeline, and arguably the most underestimated part. Financial PDFs are brutal to process accurately.
Annual reports mix narrative text with complex tables. Footnotes reference other sections. Charts embed data that exists nowhere in the text. Formatting varies wildly between jurisdictions. A Japanese annual report might contain kanji, hiragana, katakana, and romaji on the same page, interspersed with English financial terminology. An Arabic financial statement requires right-to-left text handling with bidirectional number rendering.
The obvious approach, feeding the whole PDF into a large vision-language model and hoping for the best, doesn't work at institutional quality. Research from financial institutions has shown that compact vision-language models in a multi-stage pipeline achieve dramatically higher field-level accuracy compared to monolithic large VLM approaches, at a fraction of the GPU cost and latency.
So we built our own pipeline:
- Layout analysis and page decomposition: the document gets broken down into its structural components before any text extraction happens.
- AI-assisted OCR: processes each page with language-aware recognition, handling mixed scripts and complex table structures.
- Entity recognition and structural classification: extracted text gets tagged and categorized.
- Scoped AI extraction: models operate on narrowed, well-defined extraction scopes rather than trying to comprehend an entire 200-page annual report in a single pass.
The multilingual capability isn't a feature we bolted on. For a Canadian asset manager covering global equities, processing filings from Tokyo, Frankfurt, São Paulo, and London with equal accuracy is a basic requirement. Our OCR engine handles 50+ languages natively, with specialized processing for CJK character sets, Arabic and Hebrew bidirectional text, and mixed-script documents.
Every extracted data point gets indexed with full provenance metadata: source document, page number, extraction confidence score, and the exact bounding box coordinates of the original text. This provenance chain is what lets analysts trust AI-generated answers and trace any claim back to its source. Without it, you're asking institutional investors to trust a black box. They won't.
The Full Stack at a Glance
| Layer | Technology | Scale | What It Does |
|---|---|---|---|
| Market Data | Databento + QuestDB on K8s | Hundreds of TB/month, trillions of rows | Exchange-level tick data, price analytics |
| Web Crawling | 3,000+ proprietary JS-rendered crawlers | Millions of pages/month | Public financial documents, filings, disclosures |
| Storage & Query | Iceberg + BigQuery + Bigtable + GCS | 30+PB in total | Unified data lakehouse across all data types |
| AI & Retrieval | Claude + Gemini + proprietary MoE (Gemma-based) | 750M+ documents; premium datasets licensed from 100+ providers and partners | Finance-specialized research generation |
| Embedding | Proprietary embedding architecture | Large-scale embedding handling | Finance-specialized vector search and retrieval |
| Compute | K8s across AWS EC2 + Google Cloud | Terabytes of RAM/month, Spot-optimized | Autoscaling orchestration for all workloads |
| Document Processing | Proprietary PDF engine + multilingual OCR | 50+ languages, millions of pages | Structured extraction from unstructured documents |
The Takeaway
None of these technology choices exist in isolation. The reason we control the full pipeline, from exchange feeds to crawler fleets to the data lakehouse to MoE models to the analyst-facing terminal, is that every layer depends on every other layer working correctly.
If the crawlers miss a filing, the AI can't cite it. If the OCR engine misreads a table, the financial metrics are wrong. If the market data has gaps, the correlations break. If the MoE model doesn't have a domain-specialized expert for credit analysis, it falls back to general-purpose reasoning and the answer quality drops.
The system works because it's end-to-end. That's the architecture. That's the thesis. And after serving 25+ institutional investment teams across North America, helping analysts save 15+ hours per week, we're more convinced of it than when we started.
AllMind provides institutional investors with an AI-powered research and data terminal spanning 750M+ documents and premium datasets licensed from 100+ providers and partners, including market data, financials, estimates, indexes, FactSet Revere, filings, broker research, Expert Insights and alternative data. See it in action.
Frequently Asked Questions
What does "petabyte-scale financial data processing" actually mean?
It means infrastructure that can ingest, store, and query datasets exceeding 1 petabyte (1,024 terabytes) of financial information per month, including market data, regulatory filings, research documents, and alternative data, while meeting production latency requirements. AllMind processes over 30PB monthly across these categories.
Why does AllMind use QuestDB instead of other time-series databases?
Financial time-series data has requirements that general-purpose time-series databases don't handle well. QuestDB provides ASOF JOIN for temporal alignment across trading venues, nanosecond-precision timestamps for high-frequency data, and ingestion rates above 11 million rows per second. Its tiered storage model also allows cost-efficient retention of years of historical tick data.
What is a Mixture-of-Experts model and why does it matter for finance?
Mixture-of-Experts (MoE) is an AI architecture that splits a model into specialized subnetworks called "experts," with a router network selecting which experts to activate per query. This gives you large total model capacity while keeping per-query compute costs low. AllMind's MoE models train individual experts on distinct financial domains (equities, credit, ESG, regulatory filings), so the system activates the right specialist knowledge for each analyst question.
How does AllMind handle financial documents in different languages?
Our proprietary OCR engine supports 50+ languages with specialized processing for CJK characters, Arabic and Hebrew bidirectional text, and mixed-script documents. Rather than feeding entire documents into a single large model, we use a multi-stage pipeline (layout analysis, language-aware OCR, entity recognition, scoped AI extraction) that achieves higher accuracy at lower compute cost.
What is Apache Iceberg and why is it used for financial data?
Apache Iceberg is an open table format for large-scale analytical datasets. Its key features for financial applications include time travel (essential for regulatory audit trails), partition evolution (change how data is organized without rewriting files), and nanosecond timestamp support. It enables ACID transactions at petabyte scale across multiple query engines.
How does AllMind reduce infrastructure costs at this scale?
Three main levers: aggressive Spot/Preemptible VM usage (60-90% cost reduction for batch workloads), tiered storage that automatically moves cold data to cheaper object storage while keeping it queryable, and Kubernetes autoscaling that matches compute to actual demand instead of provisioning for peak capacity at all times.
How fast does new financial data reach AllMind's analysts?
It depends on the data type. Exchange-level market data flows through Databento and into QuestDB in microseconds. Regulatory filings and corporate disclosures are captured by our crawler fleet within minutes of publication. Structured vendor data from partners like S&P Global, LSEG, and FactSet arrives on their respective feed schedules. The key difference versus legacy platforms is that we've eliminated the intermediary aggregation layer, so there's no extra hop adding hours or days of delay between the source and the analyst's screen.
How does AllMind ensure data accuracy across hundreds of millions of documents?
Multiple layers. Our crawlers use per-domain extraction profiles that are tuned and validated against known-good data for each source. The ETL pipeline runs deduplication, entity resolution, and quality checks before anything lands in the data lakehouse. Our PDF processing pipeline tags every extracted data point with a confidence score and exact source coordinates (document, page, bounding box), so analysts can trace any AI-generated claim back to the original text. For structured vendor data, we ingest directly from providers like S&P Global and LSEG with automated reconciliation checks against known reference values.
What data vendors does AllMind work with?
AllMind licenses its premium dataset estate from 100+ providers and partners. S&P Global and Capital IQ supply market, index, industry, pension, estimates and transcript data; LSEG supplies I/B/E/S estimates, analyst revisions, credit and M&A data; FactSet supplies fundamentals, SEC and SEDAR filings, and Revere supply-chain relationships. MSCI supplies ESG ratings, exchange partners such as CME supply market data, and major sell-side brokers supply research. These sources sit inside a broader estate of 750M+ documents. We partner where providers genuinely have an edge and build our own pipeline for market-data ingestion, web-scale document crawling, alternative-data processing, and AI-powered retrieval.
How does AllMind compare to Bloomberg Terminal or Capital IQ?
Traditional terminals package pre-filtered data with fixed analytical tools. You get what the vendor decided to include, presented in interfaces designed decades ago. AllMind combines 750M+ documents and premium datasets from those licensed relationships with domain-specialized AI that adapts to each query. The corpus includes S&P/Capital IQ market and index data, FactSet fundamentals and Revere relationships, LSEG estimates, MSCI data, and live exchange feeds. Instead of searching siloed products and copying numbers into spreadsheets, analysts can ask questions in natural language and receive sourced answers. Bloomberg and Capital IQ retain distinct execution, messaging, Office-link and field-depth advantages depending on the workflow; the distinction is not that AllMind lacks institutional data.
What is Google Bigtable and why does AllMind use it?
Google Bigtable is a fully managed, wide-column NoSQL database designed for massive scale with consistent low-latency reads. AllMind uses Bigtable as the backbone of its serving layer because its rowkey architecture allows precise, millisecond lookups across petabytes of data without scanning. Most teams in the Google Cloud ecosystem default to BigQuery for everything or try to force Firestore into patterns it wasn't designed for. Bigtable sits in a sweet spot of massive scale, predictable sub-10ms latency, and cost efficiency that makes it ideal for entity resolution, metadata retrieval, and the real-time autocomplete behind AllMind's research terminal.
How does AllMind handle web scraping at scale without getting blocked?
Financial data sources actively defend against automated crawling with rate limiting, IP blocking, CAPTCHAs, and bot detection. AllMind runs its 3,000+ crawlers through rotating proxy infrastructure with residential and datacenter IP pools, managed browser fingerprinting, and per-domain request throttling. Each domain in our knowledge base has calibrated crawling parameters to stay within acceptable request patterns while still capturing every material update within minutes. The proxy infrastructure alone took months to architect and harden at production scale.